Lynn: Fire Incidents, Indiana (IN)
Where are fire incidents reported in Lynn, IN
Something went wrong! Please refresh the page.
|
| |||||||||||||||||||||||||||||||||||||||||||||||||||||||||||||||||||||||||||||||||||||||||||||||||||||||||||||
2003 - 2018 National Fire Incident Reporting System (NFIRS) incidents
- Incident types reported to NFIRS in Lynn, IN
- 35147.1%Fire
- 31241.8%Rescue & EMS
- 334.4%Hazardous Condition
- 233.1%Good Intent Call
- 131.7%Special Incident
- 70.9%Service Call
- 60.8%False Alarm
- 10.1%Severe Weather
- Fire incident types reported to NFIRS in Lynn, IN
- 15443.9%Outside Fires
- 13337.9%Structure Fires
- 3710.5%Other
- 277.7%Mobile Property/Vehicle Fires
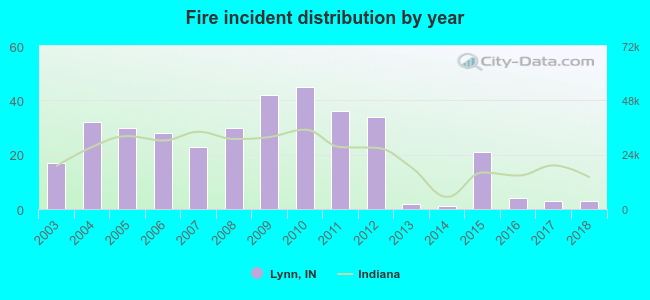 Based on the data from the years 2003 - 2018 the average number of fires per year is 22. The highest number of reported fire incidents - 45 took place in 2010, and the least - 1 in 2014. The data has a declining trend.
 27.9% incidents where reported in the morning and 72.1% in the evening. The most fires (19.9%) took place on Saturday, and the least (11.1%) on Sunday.
 Based on the 351 fires from years 2003 - 2018 most fires (13.4%) took place during March, and the least (4.3%) in January.
 Out of all 746 cases reported during the years 2003 - 2018, the most belonged to the categories: Fire (47.1%), Overpressure Rupture (41.8%), and Rescue & EMS (4.4%).
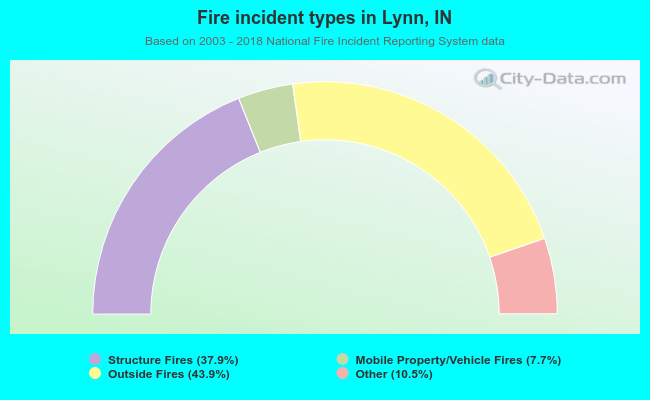 When looking into fire subcategories, the most reports belonged to: Outside Fires (43.9%), and Structure Fires (37.9%).