Malverne: Fire Incidents, New York (NY)
Where are fire incidents reported in Malverne, NY
Something went wrong! Please refresh the page.
|
| |||||||||||||||||||||||||||||||||||||||||||||||||||||||||||||||||||||||||||||||||||||||||||||||||||||||||||||
2003 - 2018 National Fire Incident Reporting System (NFIRS) incidents
- Incident types reported to NFIRS in Malverne, NY
- 40942.4%Hazardous Condition
- 20421.1%Fire
- 14615.1%False Alarm
- 959.8%Good Intent Call
- 565.8%Service Call
- 535.5%Rescue & EMS
- 20.2%Special Incident
- Fire incident types reported to NFIRS in Malverne, NY
- 9044.1%Structure Fires
- 6833.3%Outside Fires
- 2914.2%Mobile Property/Vehicle Fires
- 178.3%Other
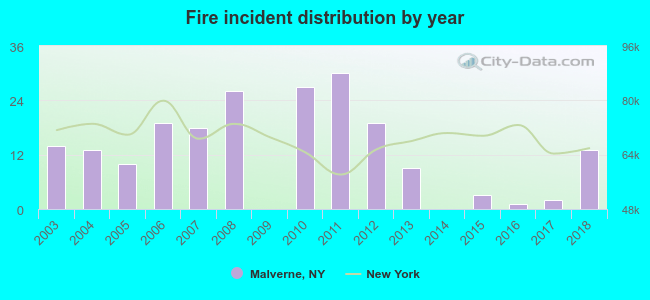 Based on the data from the years 2003 - 2018 the average number of fire incidents per year is 13. The highest number of fire incidents - 30 took place in 2011, and the least - 0 in 2009. The data has a decreasing trend.
The average number of yearly fire incidents per 10k residents in Malverne, NY compared to nearest cities:
(Note: Based on data for the last 3 years, including only cities with population 5,000 and above)
| Malverne: | 6.2 |
| Lakeview: | 6.5 |
| Lynbrook: | 6.6 |
| Valley Stream: | 12.8 |
| West Hempstead: | 19.8 |
| Franklin Square: | 5.1 |
| Rockville Centre: | 19.6 |
| East Rockaway: | 1.5 |
| Elmont: | 2.1 |
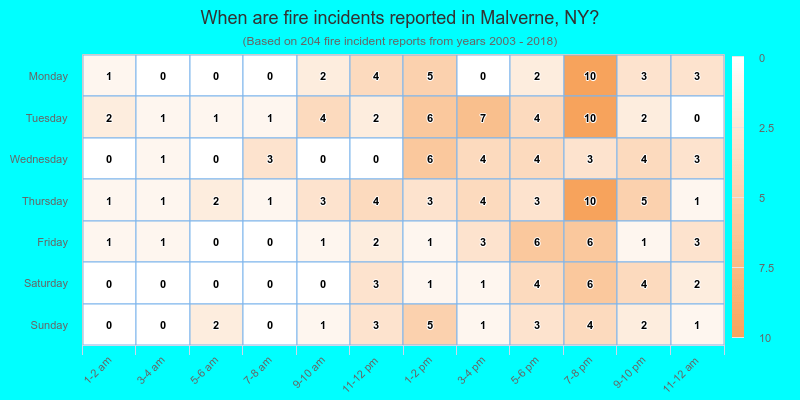
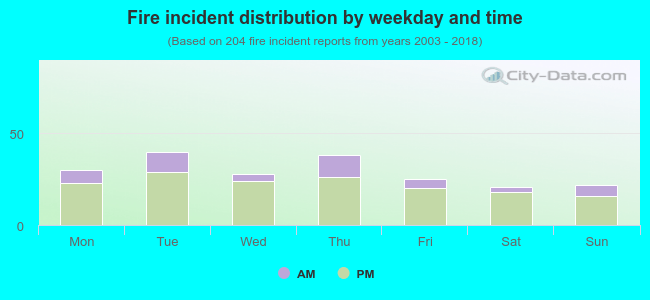 23.5% incidents where reported in the morning and 76.5% in the evening. The most fires (19.6%) took place on Tuesday, and the least (10.3%) on Saturday.
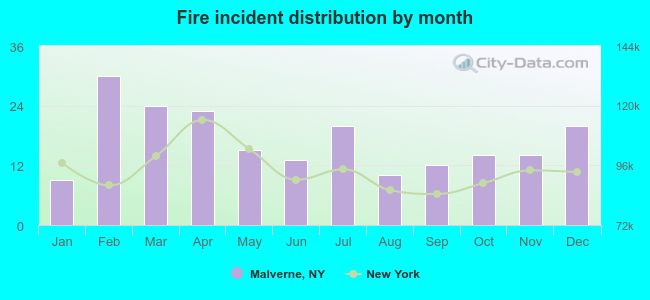 According to the 204 fire incidents from years 2003 - 2018 most fires (14.7%) took place during February, and the least (4.4%) in January.
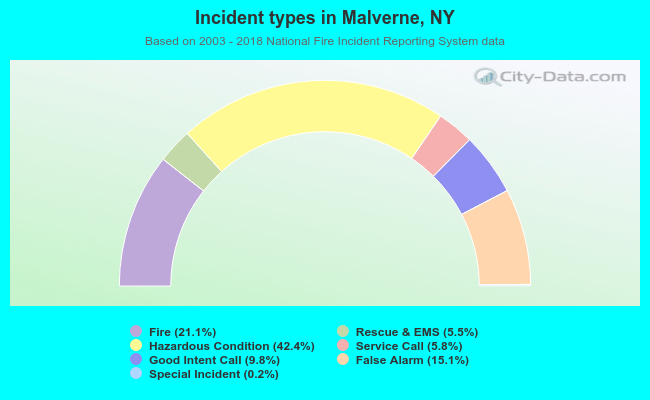 Out of all 965 cases reported during the years 2003 - 2018, the most belonged to the categories: Rescue & EMS (42.4%), Fire (21.1%), and Good Intent Call (15.1%).
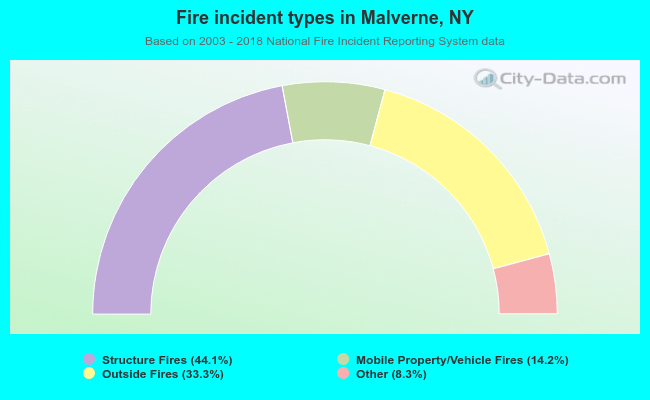 When looking into fire subcategories, the most reports belonged to: Structure Fires (44.1%), and Outside Fires (33.3%).