Manassas: Fire Incidents, Virginia (VA)
Where are fire incidents reported in Manassas, VA
Something went wrong! Please refresh the page.
| Fire incidents reported | |
|---|---|
| Sreet name | Count |
| SUDLEY RD | 344 |
| LIBERIA AVE | 226 |
| CENTREVILLE RD | 206 |
| CENTERVILLE RD | 100 |
| DUMFRIES RD | 92 |
| LOMOND DR | 72 |
| CENTER ST | 68 |
| EUCLID AVE | 68 |
| GRANT AVE | 64 |
| WELLINGTON RD | 58 |
| GODWIN DR | 56 |
| MAIN ST | 56 |
| MATHIS AVE | 56 |
| SUDLEY MANOR DR | 56 |
| TANEY RD | 56 |
| STONEWALL RD | 54 |
| BALLS FORD RD | 52 |
| QUARRY RD | 48 |
| NOKESVILLE RD | 42 |
| YORKSHIRE LN | 42 |
| BRUTON PARISH CIR | 40 |
| MAPLEWOOD DR | 38 |
| PORTNER AVE | 38 |
| HASTINGS DR | 34 |
| PRINCE COLE CT | 34 |
| PRINCESS CAROL CT | 32 |
| COMMUNITY DR | 28 |
| COVERSTONE DR | 28 |
| MILES PL | 28 |
| MOORE DR | 28 |
| Other | 1,999 |
2003 - 2018 National Fire Incident Reporting System (NFIRS) incidents
- Incident types reported to NFIRS in Manassas, VA
- 34,85662.8%Rescue & EMS
- 7,44013.4%Good Intent Call
- 4,1437.5%Fire
- 3,0185.4%Hazardous Condition
- 2,1713.9%False Alarm
- 1,9453.5%Special Incident
- 1,8793.4%Service Call
- 660.1%Overpressure Rupture
- Fire incident types reported to NFIRS in Manassas, VA
- 2,50760.5%Structure Fires
- 1,03024.9%Outside Fires
- 3177.7%Mobile Property/Vehicle Fires
- 2897.0%Other
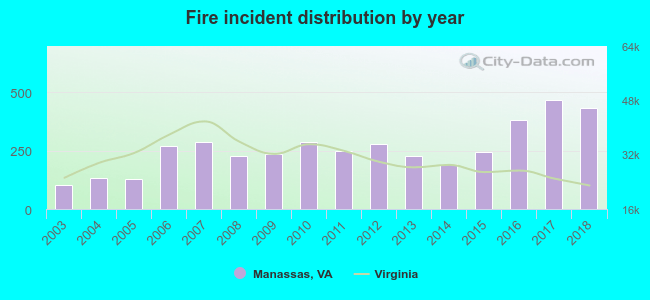 Based on the data from the years 2003 - 2018 the average number of fires per year is 259. The highest number of fires - 466 took place in 2017, and the least - 102 in 2003. The data has a rising trend.
The average number of yearly fire incidents per 10k residents in Manassas, VA compared to nearest cities:
(Note: Based on data for the last 3 years, including only cities with population 5,000 and above)
| Manassas: | 101.6 |
| Manassas Park: | 17.4 |
| Yorkshire: | 1.3 |
| Centreville: | 14.7 |
| Gainesville: | 42.1 |
| Fairfax Station: | 26.3 |
| Chantilly: | 39.8 |
| Dale City: | 0.3 |
| Burke: | 11.0 |
 The median response time based on all reported fire incidents is 5 minutes. This is lower compared to the state median value.
The median response time in Manassas, VA compared to nearest cities:
(Note: Based on data for all years, including only cities with at least 500 fire incidents)
| Manassas: | 5 minutes |
| Manassas Park: | 4 minutes |
| Centreville: | 6 minutes |
| Chantilly: | 6 minutes |
| Fairfax: | 6 minutes |
| Lorton: | 6 minutes |
| Woodbridge: | 5 minutes |
| Annandale: | 5 minutes |
| Vienna: | 5 minutes |
 Based on the data from the years 2003 - 2018 the average number of fire-related casualties per year is 1. The highest number of injuries - 7 took place in 2007, and the lowest - 0 in 2003. The data has an increasing trend.
The average number of injuries per 1,000 fire incidents is 5. This indicator was the highest - 24 in 2007, and the lowest 0 in 2003. The trend for injuries per 1,000 fires is rising. Compared to the Virginia value the number of injuries per 1,000 fires is much lower.
Based on the data from the years 2003 - 2018 the average number of fire-related casualties per year is 1. The highest number of injuries - 7 took place in 2007, and the lowest - 0 in 2003. The data has an increasing trend.
The average number of injuries per 1,000 fire incidents is 5. This indicator was the highest - 24 in 2007, and the lowest 0 in 2003. The trend for injuries per 1,000 fires is rising. Compared to the Virginia value the number of injuries per 1,000 fires is much lower.Casualties per 1,000 incidents in Manassas, VA compared to nearest cities:
(Note: Based on data for all years, including only cities with at least 500 fire incidents)
| Manassas: | 5.1 |
| Manassas Park: | 9.4 |
| Centreville: | 0.0 |
| Chantilly: | 4.3 |
| Fairfax: | 1.2 |
| Lorton: | 0.0 |
| Woodbridge: | 0.0 |
| Annandale: | 6.0 |
| Vienna: | 0.0 |
 30.3% incidents where reported in the morning and 69.7% in the evening. The most fires (15.7%) took place on Monday, and the least (12.6%) on Tuesday.
 According to the 4,143 incident reports from years 2003 - 2018 most fires (10.7%) took place during April, and the least (6.3%) in September.
 Out of all 55,536 cases reported during the years 2003 - 2018, the most belonged to the categories: Rescue & EMS (62.8%), Good Intent Call (13.4%), and Fire (7.5%).
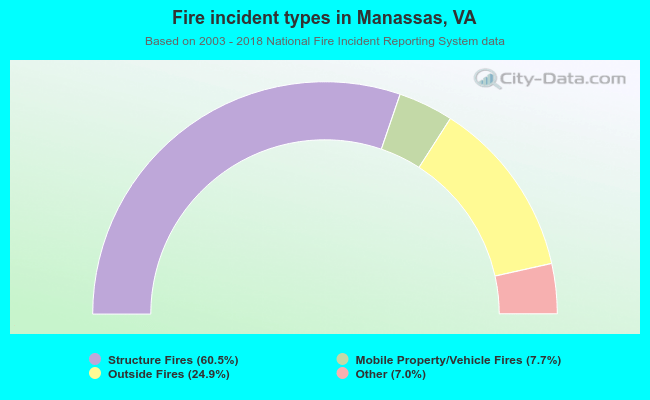 When looking into fire subcategories, the most incidents belonged to: Structure Fires (60.5%), and Outside Fires (24.9%).