Manchester: Fire Incidents, Iowa (IA)
Where are fire incidents reported in Manchester, IA
Something went wrong! Please refresh the page.
|
| |||||||||||||||||||||||||||||||||||||||||||||||||||||||||||||||||||||||||||||||||||||||||||||||||||||||||||||
2003 - 2018 National Fire Incident Reporting System (NFIRS) incidents
- Incident types reported to NFIRS in Manchester, IA
- 24241.1%Fire
- 14524.6%Rescue & EMS
- 549.2%Service Call
- 528.8%Hazardous Condition
- 406.8%Severe Weather
- 335.6%False Alarm
- 132.2%Good Intent Call
- 81.4%Special Incident
- 20.3%Overpressure Rupture
- Fire incident types reported to NFIRS in Manchester, IA
- 9438.8%Structure Fires
- 7932.6%Outside Fires
- 3916.1%Other
- 3012.4%Mobile Property/Vehicle Fires
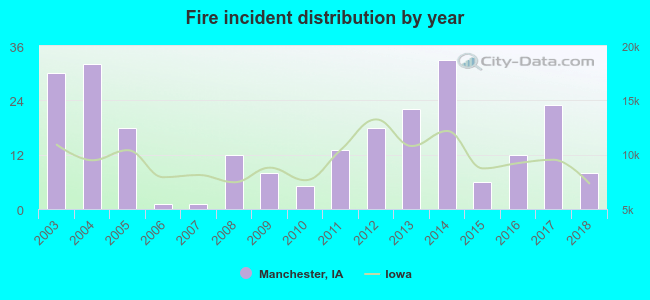 According to the data from the years 2003 - 2018 the average number of fire incidents per year is 15. The highest number of fire incidents - 33 took place in 2014, and the least - 1 in 2006. The data has a declining trend.
The average number of yearly fire incidents per 10k residents in Manchester, IA compared to nearest cities:
(Note: Based on data for the last 3 years, including only cities with population 5,000 and above)
| Manchester: | 28.2 |
| Independence: | 18.9 |
| Oelwein: | 54.2 |
| Anamosa: | 15.4 |
| Marion: | 16.2 |
| Hiawatha: | 46.8 |

 29.3% incidents where reported in the morning and 70.7% in the evening. The most fires (17.8%) took place on Thursday, and the least (10.3%) on Sunday.
 Based on the 242 reports from years 2003 - 2018 most fires (14.9%) took place during April, and the least (5.8%) in January.
 Out of all 589 cases reported during the years 2003 - 2018, the most belonged to the categories: Fire (41.1%), Rescue & EMS (24.6%), and Service Call (9.2%).
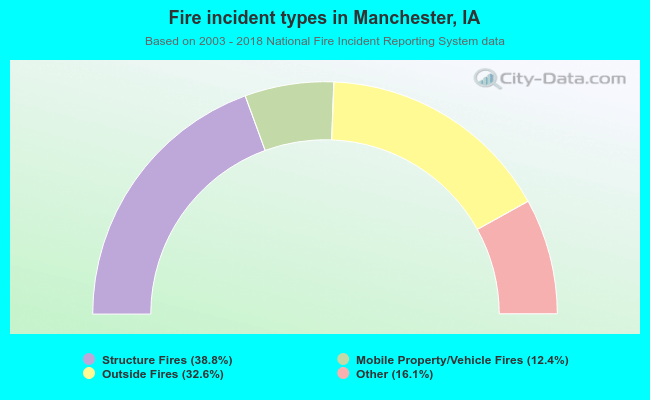 When looking into fire subcategories, the most reports belonged to: Structure Fires (38.8%), and Outside Fires (32.6%).