Mandan: Fire Incidents, North Dakota (ND)
Where are fire incidents reported in Mandan, ND
Something went wrong! Please refresh the page.
| Fire incidents reported | |
|---|---|
| Sreet name | Count |
| 3RD ST | 102 |
| MAIN ST | 102 |
| MEMORIAL HWY | 72 |
| 6TH AVE | 62 |
| 1ST ST | 44 |
| 8TH AVE | 38 |
| HWY 6 | 38 |
| 3RD AVE | 36 |
| 9TH AVE | 36 |
| HWY 1806 SOUTH | 36 |
| TWIN CITY DR | 36 |
| 2ND ST | 32 |
| 10TH AVE | 30 |
| 1ST AVE | 30 |
| HWY 1806 | 28 |
| 2ND AVE | 26 |
| OLD RED TRL | 26 |
| INTERSTATE 94 | 24 |
| 4TH AVE | 22 |
| 1806 HWY | 20 |
| 40TH AVE | 20 |
| 46TH AVE | 20 |
| I94 | 20 |
| HWY 1806 NORTH | 18 |
| MCKENZIE DR | 18 |
| 15TH ST | 16 |
| COLLINS AVE | 16 |
| DIVISION ST | 16 |
| FRONTIER TRL | 16 |
| LYONS ROAD | 16 |
| Other | 231 |
2002 - 2018 National Fire Incident Reporting System (NFIRS) incidents
- Incident types reported to NFIRS in Mandan, ND
- 5,67862.5%Rescue & EMS
- 1,24713.7%Fire
- 7268.0%False Alarm
- 6677.3%Hazardous Condition
- 5025.5%Good Intent Call
- 2442.7%Service Call
- 160.2%Special Incident
- Fire incident types reported to NFIRS in Mandan, ND
- 53643.0%Outside Fires
- 42434.0%Structure Fires
- 26521.3%Mobile Property/Vehicle Fires
- 221.8%Other
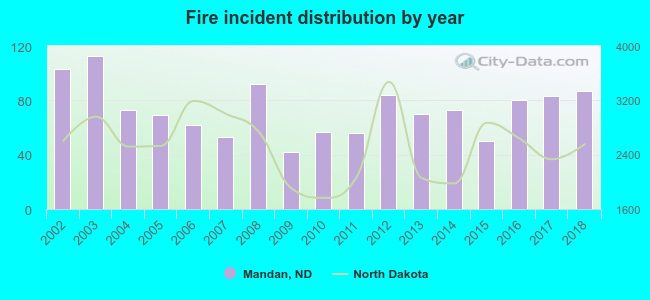 According to the data from the years 2002 - 2018 the average number of fires per year is 73. The highest number of reported fires - 113 took place in 2003, and the least - 42 in 2009. The data has a declining trend.
The average number of yearly fire incidents per 10k residents in Mandan, ND compared to nearest cities:
(Note: Based on data for the last 3 years, including only cities with population 5,000 and above)
| Mandan: | 40.0 |
| Bismarck: | 22.7 |
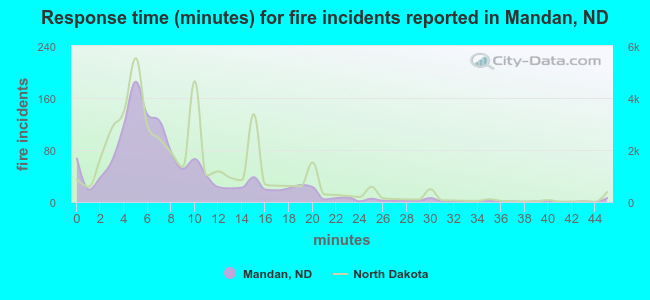 The median response time based on all reported fire incidents is 6 minutes. This is lower compared to the North Dakota median value.
The median response time in Mandan, ND compared to nearest cities:
(Note: Based on data for all years, including only cities with at least 500 fire incidents)
| Mandan: | 6 minutes |
| Bismarck: | 6 minutes |
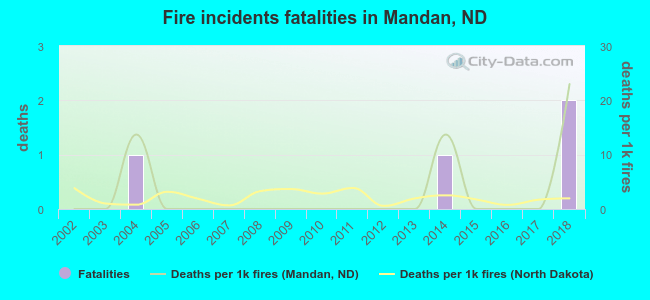 According to the reports from the years 2002 - 2018 the average number of fire-related yearly deaths is 0. The highest number of reported deaths - 2 took place in 2018, and the lowest - 0 in 2002. The data has a growing trend.
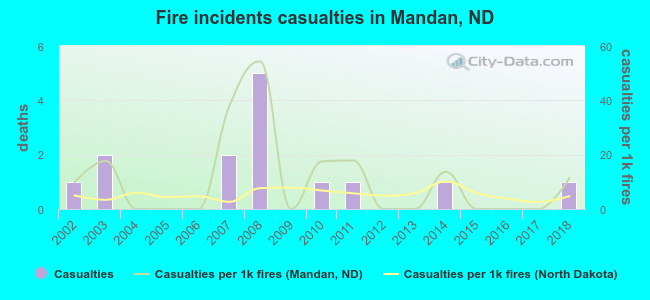 According to the reports from the years 2002 - 2018 the average number of fire-related yearly casualties is 1. The highest number of injuries - 5 took place in 2008, and the lowest - 0 in 2004. The data has a constant trend.
The average number of injuries per 1,000 fire incidents is 11. This indicator was the highest - 54 in 2008, and the lowest 0 in 2004. The trend for injuries per 1,000 incidents is rising. Compared to the North Dakota value the number of injuries per 1,000 fires is much higher.
According to the reports from the years 2002 - 2018 the average number of fire-related yearly casualties is 1. The highest number of injuries - 5 took place in 2008, and the lowest - 0 in 2004. The data has a constant trend.
The average number of injuries per 1,000 fire incidents is 11. This indicator was the highest - 54 in 2008, and the lowest 0 in 2004. The trend for injuries per 1,000 incidents is rising. Compared to the North Dakota value the number of injuries per 1,000 fires is much higher.Casualties per 1,000 incidents in Mandan, ND compared to nearest cities:
(Note: Based on data for all years, including only cities with at least 500 fire incidents)
| Mandan: | 11.2 |
| Bismarck: | 5.3 |
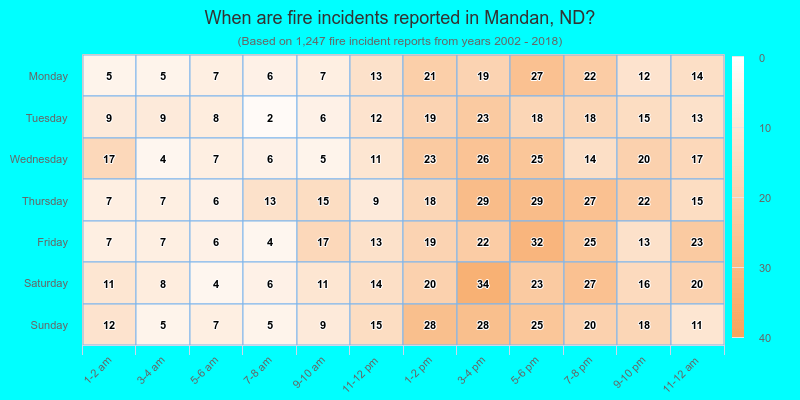
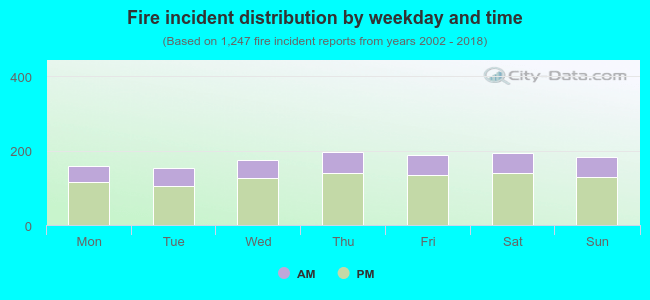 28.6% incidents where reported in the morning and 71.4% in the evening. The most fires (15.8%) took place on Thursday, and the least (12.2%) on Tuesday.
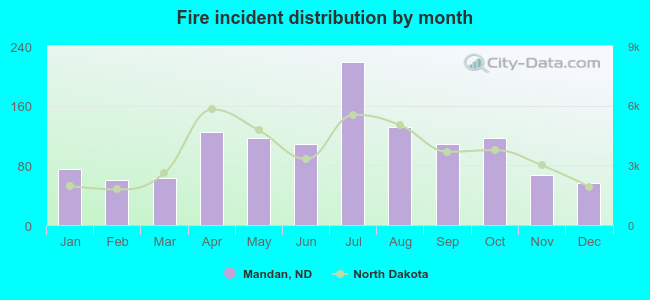 Based on the 1,247 fires from years 2002 - 2018 most fires (17.6%) took place during July, and the least (4.5%) in December.
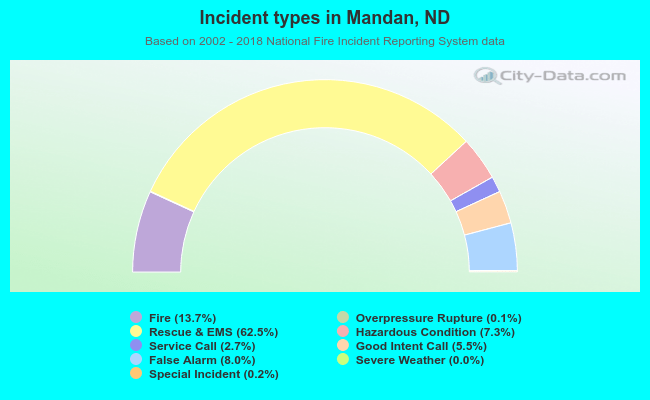 Out of all 9,089 cases reported during the years 2002 - 2018, the most belonged to the categories: Rescue & EMS (62.5%), Fire (13.7%), and False Alarm (8.0%).
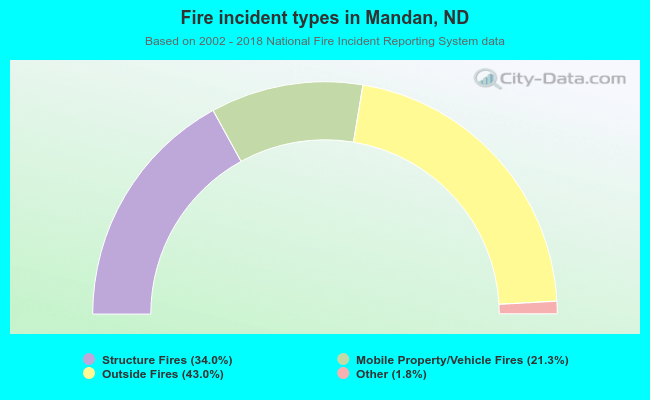 When looking into fire subcategories, the most incidents belonged to: Outside Fires (43.0%), and Structure Fires (34.0%).