| Fire incidents reported |
|---|
| Sreet name | Count |
|---|
| LOUIS TITTLE | 30 | | COLORADO | 18 | | TYLER | 12 | | GRANT | 10 | | PENN. | 10 | | GLENN | 8 | | LINCOLN | 8 | | OKLAHOMA | 8 | | COUNTY ROAD | 6 | | DELAWARE | 6 | | LOUISANA | 6 | | PENN | 6 | | ROBINSON | 6 | | 2 MILES S OF MANGUM | 4 | | DELWARE | 4 | | HAYES | 4 | | HWY-34 & E CR 1460 | 4 | | JEFFERSON | 4 | | KENTUCKY | 4 | | LOUISIANA | 4 | | MERRIT ROAD | 4 | | SOUTH STREET | 4 | | SUNSET DRIVE | 4 | | 1 M W ON HEY 9 | 2 | | 100 N PENN | 2 |
| | | Fire incidents reported |
|---|
| Sreet name | Count |
|---|
| 105 E TYLER | 2 | | 109 E JEFFERSON | 2 | | 113 E JEFFERSON | 2 | | 1320 N DELAWARE | 2 | | 13366 N C R 1940 | 2 | | 15466 N CR 1880 | 2 | | 1550 E. COUNTY ROAD | 2 | | 1600 BLOCK N LOUISTITTLE | 2 | | 1870 N CR & 1480 E CR | 2 | | 19347 ST. HWY 44 | 2 | | 2 MI E OF HWY 34 CR1550 | 2 | | 216 S LOUISANA | 2 | | 221 S LOUISTITLE | 2 | | 22513 HWY-283 / 34 | 2 | | 27194 E CR 1520 | 2 | | 29589STHWAY#9 | 2 | | 3 MLS EAST ON E CR 1330 | 2 | | 301 N ALPHA | 2 | | 321 E LINCOLN | 2 | | 321 N LOUISTITLE | 2 | | 325 E CLEVLAND | 2 | | 32651 E C R 1490 | 2 | | 32651 ECR 1490 | 2 | | 35470 US HIGHWAY 283 | 2 | | |
|
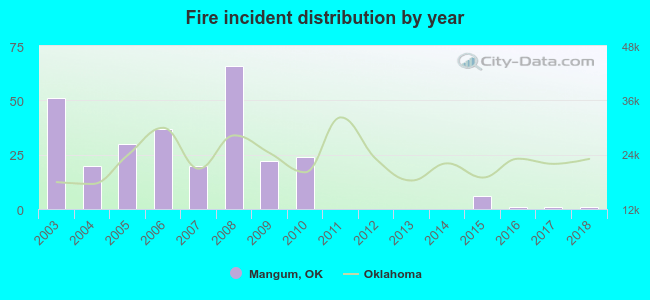 Based on the data from the years 2003 - 2018 the average number of fires per year is 17. The highest number of fires - 66 took place in 2008, and the least - 0 in 2011. The data has a declining trend.
 22.9% incidents where reported in the morning and 77.1% in the evening. The most fires (16.5%) took place on Sunday, and the least (10.8%) on Saturday.
 According to the 279 incident reports from years 2003 - 2018 most fires (12.2%) took place during January, and the least (4.7%) in September.
 Out of all 329 cases reported during the years 2003 - 2018, the most belonged to the categories: Fire (84.8%), Rescue & EMS (11.2%), and Service Call (1.5%).
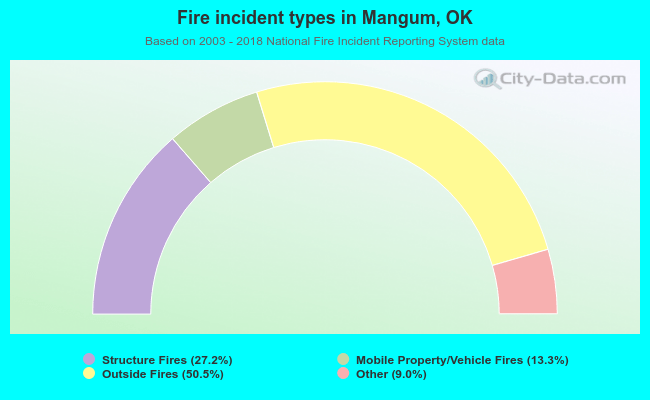 When looking into fire subcategories, the most incidents belonged to: Outside Fires (50.5%), and Structure Fires (27.2%).