Marble Hill: Fire Incidents, Missouri (MO)
Where are fire incidents reported in Marble Hill, MO
Something went wrong! Please refresh the page.
|
| |||||||||||||||||||||||||||||||||||||||||||||||||||||||||||||||||||||||||||||||||||||||||||||||||||||||||||||
| Other | 35 | |||||||||||||||||||||||||||||||||||||||||||||||||||||||||||||||||||||||||||||||||||||||||||||||||||||||||||||
2002 - 2018 National Fire Incident Reporting System (NFIRS) incidents
- Incident types reported to NFIRS in Marble Hill, MO
- 36163.3%Fire
- 508.8%Hazardous Condition
- 488.4%Good Intent Call
- 386.7%Rescue & EMS
- 366.3%Service Call
- 325.6%False Alarm
- 40.7%Severe Weather
- 10.2%Special Incident
- Fire incident types reported to NFIRS in Marble Hill, MO
- 16746.3%Outside Fires
- 11231.0%Structure Fires
- 5114.1%Mobile Property/Vehicle Fires
- 318.6%Other
 According to the data from the years 2002 - 2018 the average number of fires per year is 21. The highest number of fires - 56 took place in 2007, and the least - 2 in 2009. The data has an increasing trend.
 31.0% incidents where reported in the morning and 69.0% in the evening. The most fires (16.6%) took place on Monday, and the least (13.3%) on Wednesday.
 According to the 361 fire incidents from years 2002 - 2018 most fires (17.2%) took place during March, and the least (3.9%) in June.
 Out of all 570 cases reported during the years 2002 - 2018, the most belonged to the categories: Fire (63.3%), Rescue & EMS (8.8%), and Service Call (8.4%).
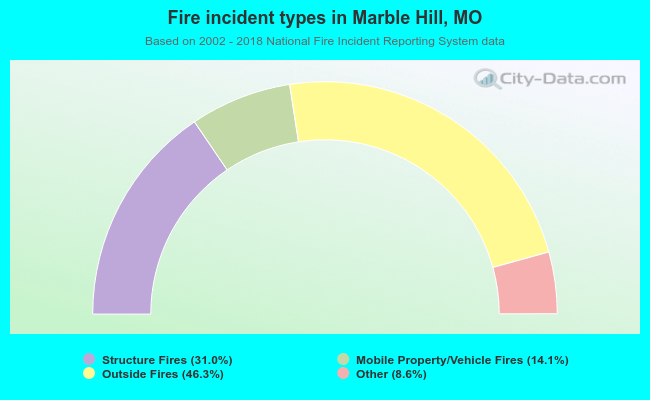 When looking into fire subcategories, the most incidents belonged to: Outside Fires (46.3%), and Structure Fires (31.0%).