| Fire incidents reported |
|---|
| Sreet name | Count |
|---|
| HWY 36 | 14 | | HWY D | 12 | | LAKE ST | 6 | | MORTON RD | 6 | | MUSSEL FORK RD | 6 | | WALKER ST | 6 | | 30804 HIGHWAY D | 4 | | CALIFORNIA | 4 | | HWY 5 | 4 | | MISSOURI HWY | 4 | | SANTA FE AVE | 4 | | SCOTT ST | 4 | | TWITCHEL RD | 4 | | 13169 HIGHWAY D | 2 | | 13768 HWY DD | 2 | | 15458 WILLIAMS AVE | 2 | | 16408 HWY DD | 2 | | 17850 KENNEL LN | 2 | | 18830 BAY LANE | 2 | | 26598 BRASSFIELD RD | 2 | | 28908 LOCKE RD | 2 | | 29313 LOCKE RD | 2 | | 300 W. HUASER ST. | 2 | | 30735 HWY 5 | 2 | | 313 E WELLS | 2 |
| | | Fire incidents reported |
|---|
| Sreet name | Count |
|---|
| 324 W GRACIA | 2 | | 32838 PEDEN CHAPEL ROAD | 2 | | 33333 KNOX RD | 2 | | 34374 MENEFEE RD. | 2 | | 421 WEST LAKE | 2 | | 5 HWY | 2 | | 504 E ASH | 2 | | 527 E LAKE | 2 | | 700 BLK S. KANSAS AVE. | 2 | | ALMOND AVENUE | 2 | | ASH ST | 2 | | BRAGGON ST | 2 | | BRASSVILLE LAKE | 2 | | BUTTON ROAD RD | 2 | | CARDINAL LN | 2 | | CIRCLE DRIVE AND POPLAR | 2 | | COUNTY RD | 2 | | CROSSROAD AVE | 2 | | CURTIS ST | 2 | | DUMP RD | 2 | | DUMP ROAD FLT | 2 | | EDGEWOOD ST | 2 | | GRACIA ST | 2 | | HAUSER ST | 2 | | |
|
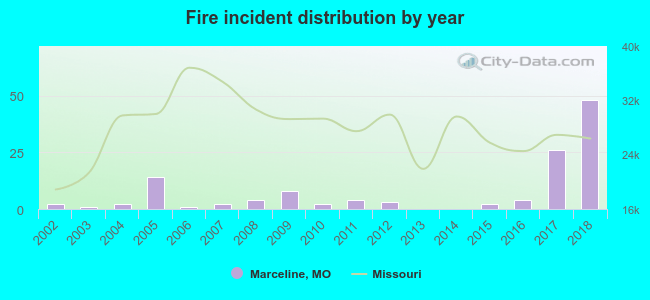 According to the data from the years 2002 - 2018 the average number of fires per year is 7. The highest number of fires - 48 took place in 2018, and the least - 0 in 2013. The data has an increasing trend.
 31.7% incidents where reported in the morning and 68.3% in the evening. The most fires (24.4%) took place on Saturday, and the least (6.5%) on Monday.
 According to the 123 fire incidents from years 2002 - 2018 most fires (22.8%) took place during March, and the least (2.4%) in September.
 Out of all 315 cases reported during the years 2002 - 2018, the most belonged to the categories: Overpressure Rupture (51.7%), Fire (39.0%), and Hazardous Condition (3.8%).
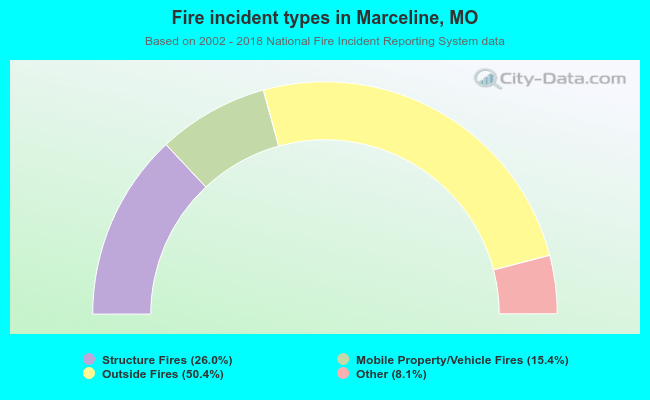 When looking into fire subcategories, the most incidents belonged to: Outside Fires (50.4%), and Structure Fires (26.0%).