| Fire incidents reported |
|---|
| Sreet name | Count |
|---|
| PLEASANT VALLEY RD | 32 | | ROUTE 20 | 28 | | MAIN ST | 26 | | SLATE HILL RD | 26 | | SENECA TPKE | 24 | | NORTH ST | 18 | | ROUTE 174 | 18 | | SEAL RD | 18 | | SOUTH ST | 18 | | FALLS RD | 16 | | HOWLETT HILL RD | 16 | | AUSTINDALE AVE | 14 | | AQUA DR | 12 | | HIGHLAND DR | 12 | | NEW SENECA TPKE | 12 | | GLOVER RD | 10 | | LAWRENCE RD | 10 | | MAPLE ST | 8 | | MASTERS RD | 8 | | SCOTCH HILL RD | 8 | | AMBER RD | 6 | | BREWER RD | 6 | | CANDLEWICK LN | 6 | | DUBLIN RD | 6 | | DUNBAR WOODS RD | 6 |
| | | Fire incidents reported |
|---|
| Sreet name | Count |
|---|
| FRANK GAY RD | 6 | | LIMELEDGE RD | 6 | | NORTH ST | 6 | | ROCKWELL RD | 6 | | ROSE HILL RD | 6 | | SECOND ST | 6 | | TOWNLINE RD | 6 | | 2779 ROSE HILL RD | 4 | | BISHOP HILL RD | 4 | | BUSSEY RD | 4 | | HIGHLAND DR | 4 | | MAPLE TER | 4 | | MEADOW ST | 4 | | OLD SENECA TPKE | 4 | | OTISCO VALLEY RD | 4 | | SEVIER RD | 4 | | SLATE HILL RD | 4 | | STUMP RD | 4 | | VAN CAMP RD | 4 | | 1362 OTISCO VALLEY RD | 2 | | 1571 OTISCO VALLEY RD | 2 | | 2376 RT 174 | 2 | | 2376 RT174 | 2 | | 2512 ROUTE 20 | 2 | | 32 SCOTCH HILL RD | 2 |
|
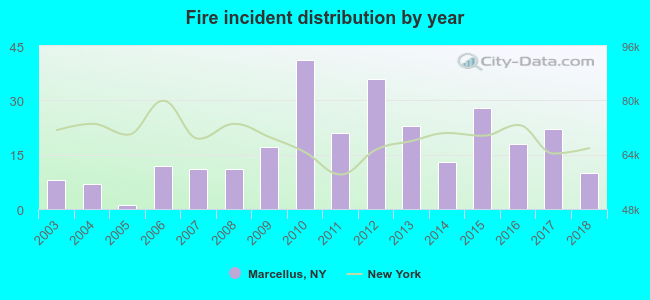 According to the data from the years 2003 - 2018 the average number of fire incidents per year is 17. The highest number of fire incidents - 41 took place in 2010, and the least - 1 in 2005. The data has a rising trend.
 34.4% incidents where reported in the morning and 65.6% in the evening. The most fires (21.1%) took place on Monday, and the least (10.4%) on Tuesday.
 According to the 279 reports from years 2003 - 2018 most fires (12.9%) took place during July, and the least (3.6%) in November.
 Out of all 1,458 cases reported during the years 2003 - 2018, the most belonged to the categories: Overpressure Rupture (28.7%), Service Call (24.2%), and Fire (19.1%).
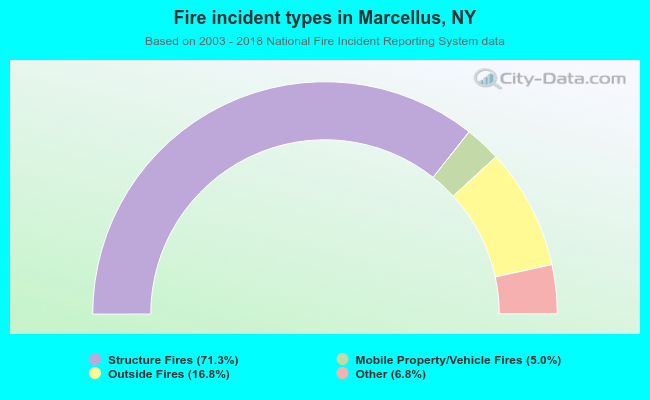 When looking into fire subcategories, the most incidents belonged to: Structure Fires (71.3%), and Outside Fires (16.8%).