Marengo: Fire Incidents, Indiana (IN)
Where are fire incidents reported in Marengo, IN
Something went wrong! Please refresh the page.
|
| |||||||||||||||||||||||||||||||||||||||||||||||||||||||||||||||||||||||||||||||||||||||||||||||||||||||||||||
2002 - 2018 National Fire Incident Reporting System (NFIRS) incidents
- Incident types reported to NFIRS in Marengo, IN
- 43150.2%Rescue & EMS
- 26631.0%Fire
- 829.6%Hazardous Condition
- 465.4%Good Intent Call
- 161.9%Service Call
- 80.9%False Alarm
- 80.9%Severe Weather
- 10.1%Special Incident
- Fire incident types reported to NFIRS in Marengo, IN
- 12346.2%Structure Fires
- 9937.2%Outside Fires
- 3212.0%Mobile Property/Vehicle Fires
- 124.5%Other
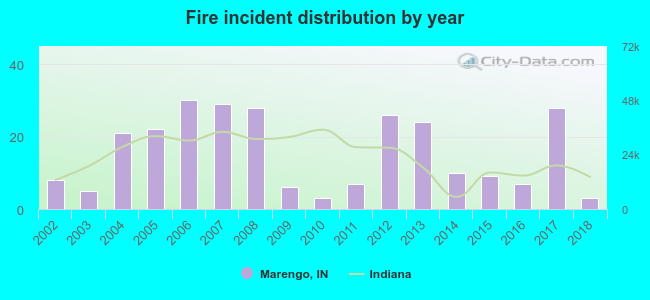 Based on the data from the years 2002 - 2018 the average number of fires per year is 16. The highest number of reported fire incidents - 30 took place in 2006, and the least - 3 in 2010. The data has a declining trend.
 29.3% incidents where reported in the morning and 70.7% in the evening. The most fires (18.0%) took place on Monday, and the least (9.4%) on Tuesday.
 Based on the 266 fires from years 2002 - 2018 most fires (18.4%) took place during March, and the least (4.9%) in July.
 Out of all 858 cases reported during the years 2002 - 2018, the most belonged to the categories: Overpressure Rupture (50.2%), Fire (31.0%), and Rescue & EMS (9.6%).
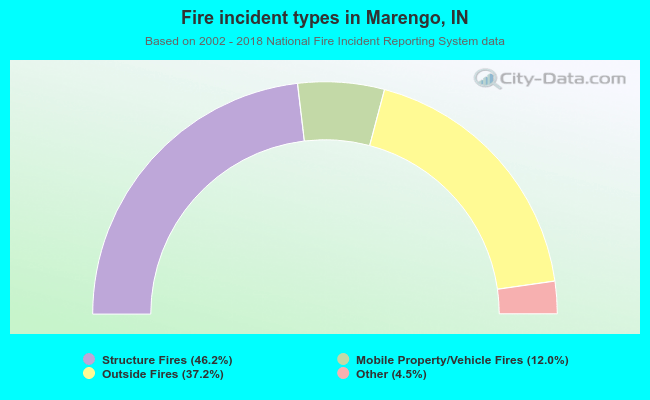 When looking into fire subcategories, the most reports belonged to: Structure Fires (46.2%), and Outside Fires (37.2%).