Marfa: Fire Incidents, Texas (TX)
Where are fire incidents reported in Marfa, TX
Something went wrong! Please refresh the page.
|
| |||||||||||||||||||||||||||||||||||||||||||||||||||||||||||||||||||||||||||||||||||||||||||||
| Other | 75 | |||||||||||||||||||||||||||||||||||||||||||||||||||||||||||||||||||||||||||||||||||||||||||||
2005 - 2018 National Fire Incident Reporting System (NFIRS) incidents
- Incident types reported to NFIRS in Marfa, TX
- 18766.5%Fire
- 279.6%Service Call
- 207.1%Rescue & EMS
- 196.8%Hazardous Condition
- 165.7%Good Intent Call
- 93.2%False Alarm
- 31.1%Special Incident
- Fire incident types reported to NFIRS in Marfa, TX
- 15381.8%Outside Fires
- 168.6%Mobile Property/Vehicle Fires
- 137.0%Structure Fires
- 52.7%Other
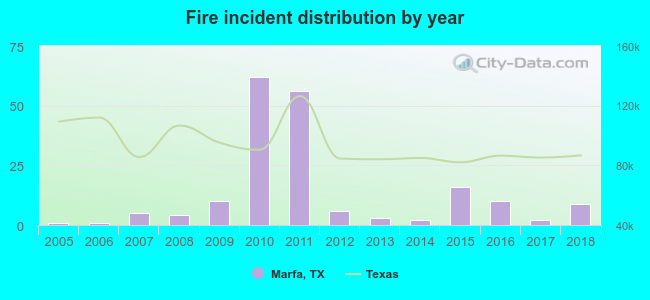 Based on the data from the years 2005 - 2018 the average number of fire incidents per year is 13. The highest number of reported fires - 62 took place in 2010, and the least - 1 in 2005. The data has an increasing trend.
 28.3% incidents where reported in the morning and 71.7% in the evening. The most fires (19.8%) took place on Tuesday, and the least (10.7%) on Saturday.
 According to the 187 fires from years 2005 - 2018 most fires (16.6%) took place during May, and the least (1.1%) in October.
 Out of all 281 cases reported during the years 2005 - 2018, the most belonged to the categories: Fire (66.5%), Hazardous Condition (9.6%), and Overpressure Rupture (7.1%).
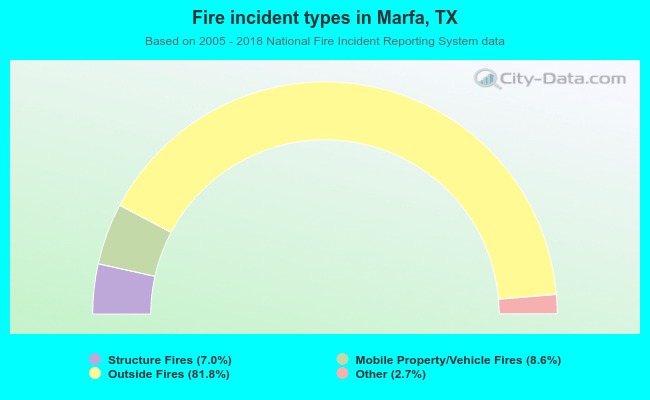 When looking into fire subcategories, the most incidents belonged to: Outside Fires (81.8%), and Mobile Property/Vehicle Fires (8.6%).