| Fire incidents reported |
|---|
| Sreet name | Count |
|---|
| WATERTANK RD | 12 | | POST MILL ROAD | 10 | | LITROE LOOP RD | 8 | | CONCORD RD | 6 | | CROW FARM RD | 6 | | HWY 143 | 6 | | HWY 549 | 6 | | HWY 551 | 6 | | JACKSON SLOUGH ROAD | 6 | | POST MILL RD | 6 | | ALABAMA LANDING RD | 4 | | AUGER ROAD | 4 | | CROW FARM ROAD | 4 | | DEFEE LANKFORD RD | 4 | | HWY 348 | 4 | | HWY 827 | 4 | | LIBERTY CHURCH ROAD | 4 | | LINVILLE FIRE TOWER RD | 4 | | LOVE RD | 4 | | MASON DIXON RD | 4 | | OAKLAND HIGHWAY | 4 | | TIGER BEND RD | 4 | | TIGER BEND ROAD | 4 | | UNION CEMETARY RD | 4 | | WHEELER RD | 4 |
| | | Fire incidents reported |
|---|
| Sreet name | Count |
|---|
| 109REYNOLDS RD | 2 | | 118 MCELROY ROAD | 2 | | 120 KYLE STREET | 2 | | 127 LINZIE RILEY RD | 2 | | 132 ST. PAUL CHURCH ROAD | 2 | | 1390 TIGER BEND ROAD | 2 | | 1393 MOSHACK ROAD | 2 | | 140 ANDREWS STREET | 2 | | 1482 HWY. 33 SOUTH | 2 | | 1502 HWY 143 | 2 | | 1584 THOMAS STREET | 2 | | 182 CROW STREET | 2 | | 191 SIMMONS ST | 2 | | 205 MCKINNIE DR. | 2 | | 206 FAIRVIEW LOOP | 2 | | 209 JAMIE ALFORD ROAD LGTS | 2 | | 211 HWY 549 HWY | 2 | | 251 HAILE BAPTIST CHURCH RD | 2 | | 258 TIGER BEND RD. | 2 | | 260 DOLLAR REPPOND RD | 2 | | 2728 ALABAMA LANDING ROAD | 2 | | 2749 HIGHWAY 549 HIGH | 2 | | 2950 TAYLOR STREET | 2 | | 319 WHEELER RD | 2 | | |
|
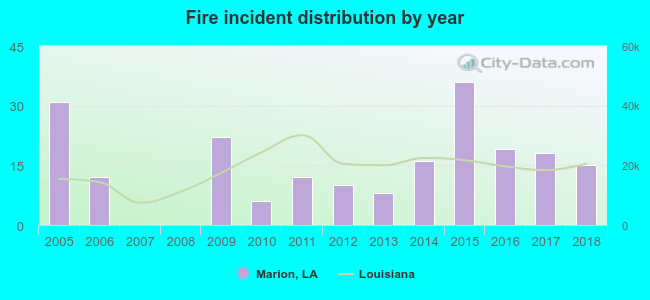 Based on the data from the years 2005 - 2018 the average number of fires per year is 15. The highest number of fires - 36 took place in 2015, and the least - 0 in 2007. The data has a dropping trend.
 25.9% incidents where reported in the morning and 74.1% in the evening. The most fires (17.1%) took place on Monday, and the least (11.7%) on Tuesday.
 According to the 205 fire incidents from years 2005 - 2018 most fires (16.6%) took place during October, and the least (3.4%) in November.
 Out of all 536 cases reported during the years 2005 - 2018, the most belonged to the categories: Rescue & EMS (50.6%), Fire (38.2%), and Hazardous Condition (5.4%).
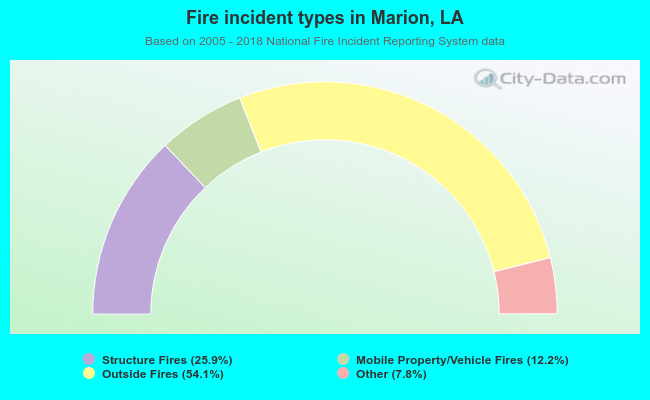 When looking into fire subcategories, the most reports belonged to: Outside Fires (54.1%), and Structure Fires (25.9%).