Marks: Fire Incidents, Mississippi (MS)
Where are fire incidents reported in Marks, MS
Something went wrong! Please refresh the page.
|
| |||||||||||||||||||||||||||||||||||||||||||||||||||||||||||||||||||||||||||||||||||||||||||||||||||||||||||||
2003 - 2018 National Fire Incident Reporting System (NFIRS) incidents
- Incident types reported to NFIRS in Marks, MS
- 71086.6%Fire
- 485.9%Hazardous Condition
- 303.7%Good Intent Call
- 111.3%Service Call
- 101.2%Rescue & EMS
- 91.1%False Alarm
- 20.2%Severe Weather
- Fire incident types reported to NFIRS in Marks, MS
- 35550.0%Structure Fires
- 21830.7%Outside Fires
- 13318.7%Mobile Property/Vehicle Fires
- 40.6%Other
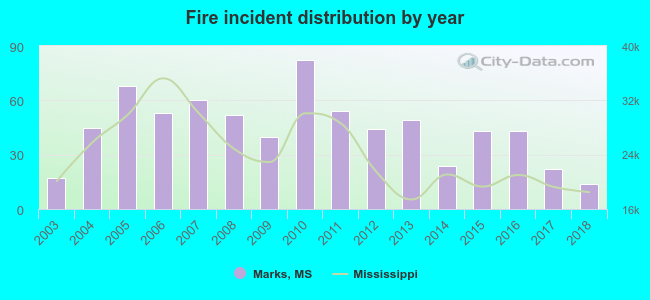 According to the data from the years 2003 - 2018 the average number of fires per year is 44. The highest number of reported fire incidents - 82 took place in 2010, and the least - 14 in 2018. The data has a declining trend.
 The median response time based on all reported fire incidents is 9 minutes. This is higher compared to the Mississippi median value.
The median response time in Marks, MS compared to nearest cities:
(Note: Based on data for all years, including only cities with at least 500 fire incidents)
| Marks: | 9 minutes |
| Lambert: | 9 minutes |
| Clarksdale: | 4 minutes |
| Courtland: | 12 minutes |
| Pope: | 12 minutes |
| Batesville: | 10 minutes |
| Charleston: | 9 minutes |
| Sardis: | 10 minutes |
| Como: | 12 minutes |
 According to the reports from the years 2003 - 2018 the average number of fire-related yearly deaths is 0. The highest number of deaths - 3 took place in 2009, and the lowest - 0 in 2003. The data has a constant trend.
 33.8% incidents where reported in the morning and 66.2% in the evening. The most fires (16.8%) took place on Friday, and the least (11.7%) on Sunday.
 According to the 710 fire incident reports from years 2003 - 2018 most fires (12.7%) took place during October, and the least (5.9%) in August.
 Out of all 820 cases reported during the years 2003 - 2018, the most belonged to the categories: Fire (86.6%), Rescue & EMS (5.9%), and Service Call (3.7%).
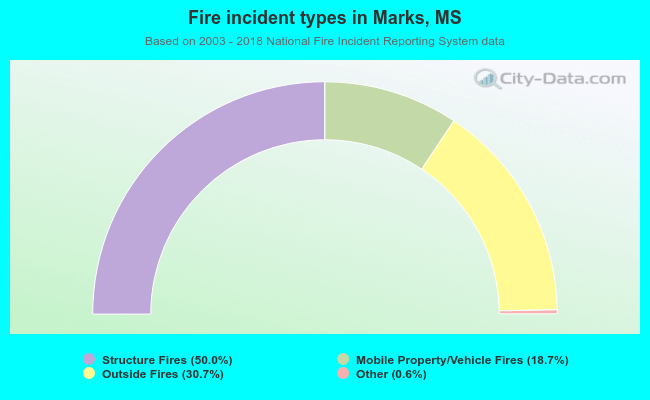 When looking into fire subcategories, the most reports belonged to: Structure Fires (50.0%), and Outside Fires (30.7%).