| Fire incidents reported |
|---|
| Sreet name | Count |
|---|
| ROUTE 9W RT | 30 | | RIVERVIEW DR | 28 | | LATTINTOWN RD | 18 | | WESTERN AVE | 18 | | PLATTEKILL RD | 12 | | PROSPECT ST | 10 | | RTE 9W | 10 | | BINGHAM RD | 8 | | RESERVOIR RD | 8 | | DOCK RD | 6 | | HIGHLAND AVE | 6 | | IDLEWILD RD | 6 | | LYONS LN | 6 | | RIDGE RD | 6 | | SOUTH ST | 6 | | BINGHAM RD | 4 | | HIDDEN ACRES RD | 4 | | HILLCREST MANOR DR | 4 | | HUDSON CIRCLE | 4 | | HUDSON TER | 4 | | MCLAUGHIN DR | 4 | | MT ZION RD | 4 | | RUBY RD | 4 | | WESTERN AVE | 4 | | 203 BAILEYS GAP RD | 2 |
| | | Fire incidents reported |
|---|
| Sreet name | Count |
|---|
| ANNA PL | 2 | | BERRY RD | 2 | | BLOSSOM HILL DR | 2 | | BURMA RD | 2 | | CALVIN DR | 2 | | CAPBELL DR | 2 | | CHURCH ST | 2 | | CROSS RD | 2 | | DRAGOTTA LN | 2 | | GERENTINE WAY | 2 | | GOBBLERS KNOB RD | 2 | | GRAND ST | 2 | | GRAND STREET | 2 | | HAMPTON RD | 2 | | HERMAN DR | 2 | | HILLSIDE DR | 2 | | HUCKLEBERRY TPKE | 2 | | HUDSON BLUFF | 2 | | IDLEWILD RD | 2 | | KAYLA CT | 2 | | LOCUST TREE RD | 2 | | MARLBORO YACHT CLUB | 2 | | MILLS PL | 2 | | OLD INDIAN RD | 2 | | ORANGE ST | 2 |
|
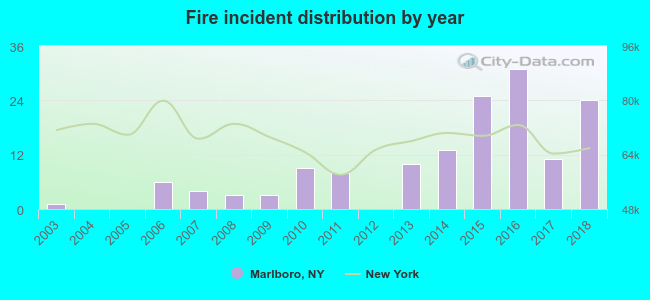 According to the data from the years 2003 - 2018 the average number of fire incidents per year is 9. The highest number of fire incidents - 31 took place in 2016, and the least - 0 in 2004. The data has a rising trend.
 33.8% incidents where reported in the morning and 66.2% in the evening. The most fires (16.9%) took place on Tuesday, and the least (11.5%) on Thursday.
 According to the 148 reports from years 2003 - 2018 most fires (16.2%) took place during April, and the least (2.7%) in July.
 Out of all 1,250 cases reported during the years 2003 - 2018, the most belonged to the categories: Hazardous Condition (59.4%), False Alarm (18.4%), and Fire (11.8%).
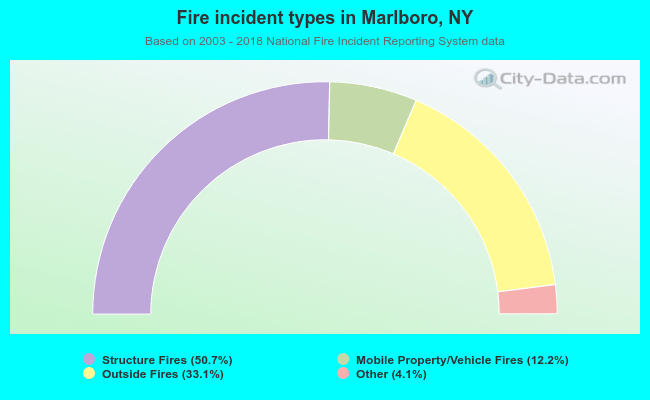 When looking into fire subcategories, the most incidents belonged to: Structure Fires (50.7%), and Outside Fires (33.1%).