Marshall: Fire Incidents, Arkansas (AR)
Where are fire incidents reported in Marshall, AR
Something went wrong! Please refresh the page.
|
| |||||||||||||||||||||||||||||||||||||||||||||||||||||||||||||||||||||||||||||||||||||||||||||||||||||||||||||
| Other | 63 | |||||||||||||||||||||||||||||||||||||||||||||||||||||||||||||||||||||||||||||||||||||||||||||||||||||||||||||
2002 - 2018 National Fire Incident Reporting System (NFIRS) incidents
- Incident types reported to NFIRS in Marshall, AR
- 40177.6%Fire
- 9017.4%Rescue & EMS
- 142.7%Good Intent Call
- 81.5%Hazardous Condition
- 20.4%Service Call
- 20.4%False Alarm
- Fire incident types reported to NFIRS in Marshall, AR
- 26365.6%Outside Fires
- 9824.4%Structure Fires
- 348.5%Mobile Property/Vehicle Fires
- 61.5%Other
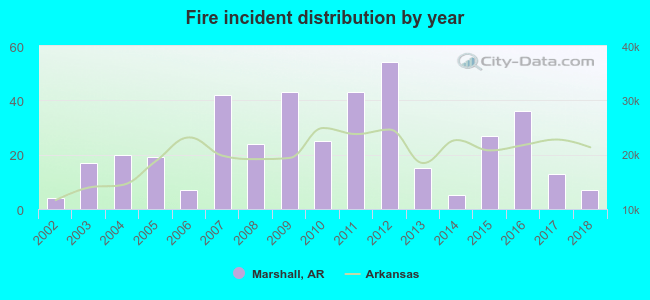 Based on the data from the years 2002 - 2018 the average number of fires per year is 24. The highest number of reported fires - 54 took place in 2012, and the least - 4 in 2002. The data has a growing trend.
 Based on the data from the years 2002 - 2018 the average number of fire-related yearly deaths is 0. The highest number of reported deaths - 1 took place in 2002, and the lowest - 0 in 2003. The data has a constant trend.
 33.9% incidents where reported in the morning and 66.1% in the evening. The most fires (17.0%) took place on Saturday, and the least (10.7%) on Monday.
 Based on the 401 fire incidents from years 2002 - 2018 most fires (19.2%) took place during March, and the least (2.5%) in June.
 Out of all 517 cases reported during the years 2002 - 2018, the most belonged to the categories: Fire (77.6%), Overpressure Rupture (17.4%), and Service Call (2.7%).
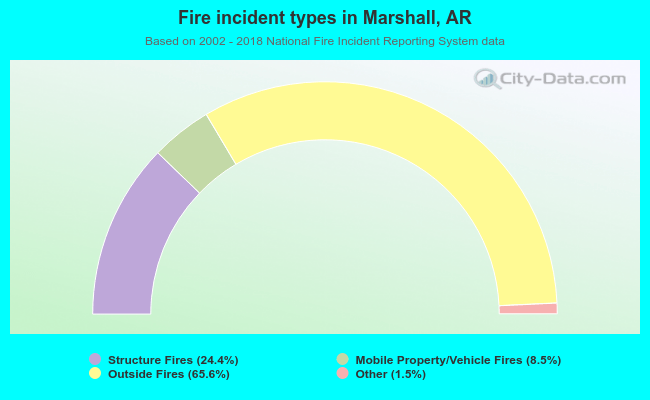 When looking into fire subcategories, the most incidents belonged to: Outside Fires (65.6%), and Structure Fires (24.4%).