Marshalltown: Fire Incidents, Iowa (IA)
Where are fire incidents reported in Marshalltown, IA
Something went wrong! Please refresh the page.
| Fire incidents reported | |
|---|---|
| Sreet name | Count |
| CENTER ST | 214 |
| MAIN ST | 200 |
| 4TH AVE | 138 |
| STATE ST | 124 |
| CHURCH ST | 112 |
| BOONE ST | 108 |
| 3RD AVE | 96 |
| 3RD ST | 92 |
| 2ND ST | 90 |
| 4TH ST | 84 |
| NEVADA ST | 84 |
| 6TH ST | 82 |
| 1ST ST | 72 |
| 2ND AVE | 66 |
| LINN ST | 66 |
| 12TH ST | 62 |
| ANSON ST | 60 |
| IOWA AVE | 60 |
| 12TH AVE | 58 |
| 1ST AVE | 58 |
| 5TH AVE | 52 |
| OLIVE ST | 50 |
| BROMLEY ST | 48 |
| JACKSON ST | 48 |
| SUMMIT ST | 48 |
| 10TH AVE | 44 |
| 7TH AVE | 44 |
| WOODBURY ST | 44 |
| 5TH ST | 42 |
| MARION ST | 42 |
2002 - 2017 National Fire Incident Reporting System (NFIRS) incidents
- Incident types reported to NFIRS in Marshalltown, IA
- 7,15460.6%Rescue & EMS
- 2,30919.6%Fire
- 7866.7%Hazardous Condition
- 6205.3%Good Intent Call
- 5584.7%False Alarm
- 3292.8%Service Call
- 190.2%Overpressure Rupture
- 180.2%Special Incident
- Fire incident types reported to NFIRS in Marshalltown, IA
- 1,52966.2%Outside Fires
- 41017.8%Structure Fires
- 25711.1%Mobile Property/Vehicle Fires
- 1134.9%Other
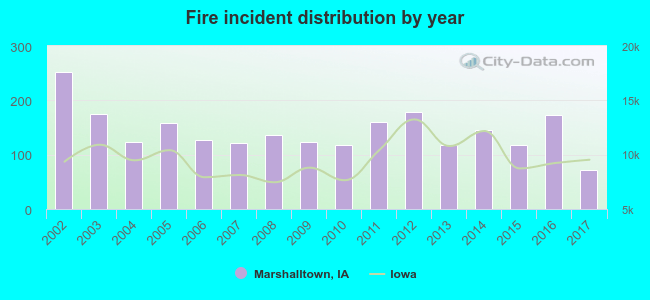 According to the data from the years 2002 - 2017 the average number of fires per year is 144. The highest number of fire incidents - 253 took place in 2002, and the least - 72 in 2017. The data has a decreasing trend.
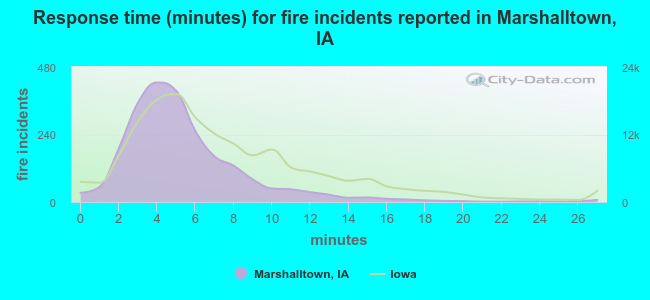 The median response time based on all reported fire incidents is 5 minutes. This is lower than the state median value.
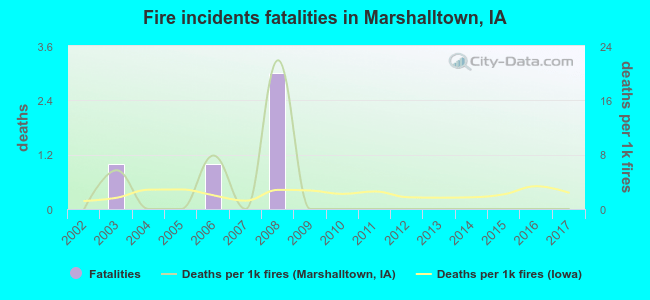 Based on the data from the years 2002 - 2017 the average number of fire-related yearly deaths is 0. The highest number of reported deaths - 3 took place in 2008, and the lowest - 0 in 2002. The data has a constant trend.
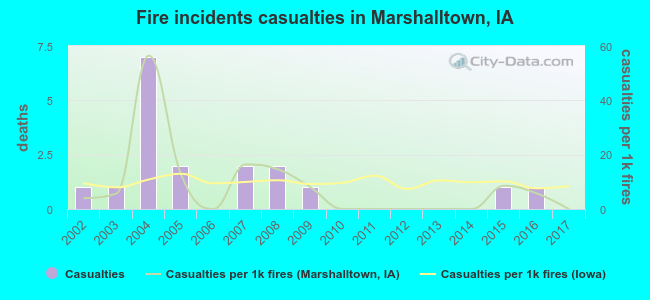 According to the data from the years 2002 - 2017 the average number of fire-related casualties per year is 1. The highest number of reported casualties - 7 took place in 2004, and the lowest - 0 in 2006. The data has a declining trend.
The average number of casualties per 1,000 fires is 8. This indicator was the highest - 56 in 2004, and the lowest 0 in 2006. The trend for casualties per 1,000 fire incidents is declining. Compared to the state value the number of injuries per 1,000 fire incidents is lower.
According to the data from the years 2002 - 2017 the average number of fire-related casualties per year is 1. The highest number of reported casualties - 7 took place in 2004, and the lowest - 0 in 2006. The data has a declining trend.
The average number of casualties per 1,000 fires is 8. This indicator was the highest - 56 in 2004, and the lowest 0 in 2006. The trend for casualties per 1,000 fire incidents is declining. Compared to the state value the number of injuries per 1,000 fire incidents is lower.
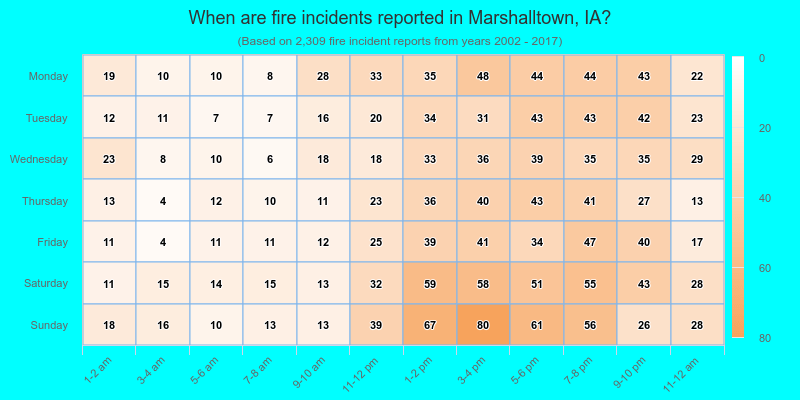
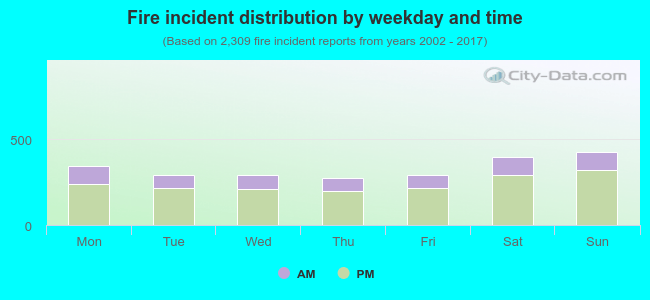 26.9% incidents where reported in the morning and 73.1% in the evening. The most fires (18.5%) took place on Sunday, and the least (11.8%) on Thursday.
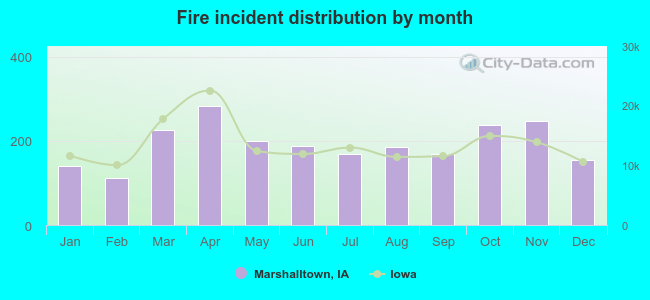 Based on the 2,309 incident reports from years 2002 - 2017 most fires (12.3%) took place during April, and the least (4.9%) in February.
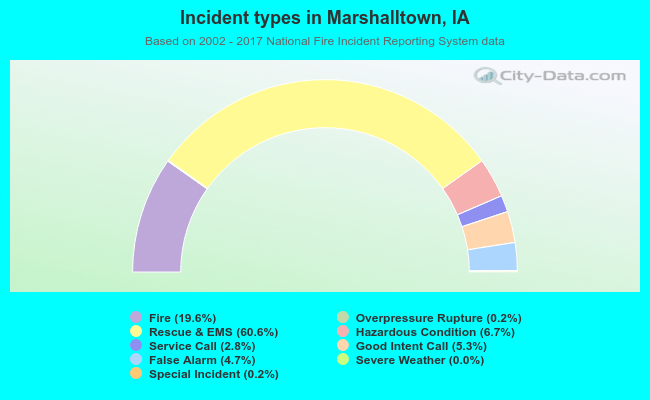 Out of all 11,796 cases reported during the years 2002 - 2017, the most belonged to the categories: Rescue & EMS (60.6%), Fire (19.6%), and Hazardous Condition (6.7%).
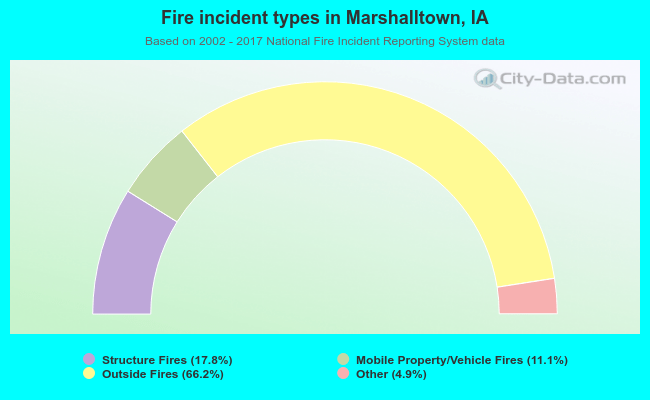 When looking into fire subcategories, the most reports belonged to: Outside Fires (66.2%), and Structure Fires (17.8%).