Masury: Fire Incidents, Ohio (OH)
Where are fire incidents reported in Masury, OH
Something went wrong! Please refresh the page.
|
| |||||||||||||||||||||||||||||||||||||||||||||||||||||||||||||||||||||||||||||||||||||||||||||||||||||||||||||
2002 - 2018 National Fire Incident Reporting System (NFIRS) incidents
- Incident types reported to NFIRS in Masury, OH
- 29543.3%Fire
- 17525.7%Hazardous Condition
- 8512.5%Service Call
- 588.5%Good Intent Call
- 375.4%False Alarm
- 121.8%Severe Weather
- 111.6%Rescue & EMS
- 60.9%Overpressure Rupture
- 30.4%Special Incident
- Fire incident types reported to NFIRS in Masury, OH
- 13646.1%Outside Fires
- 10033.9%Structure Fires
- 5819.7%Mobile Property/Vehicle Fires
- 10.3%Other
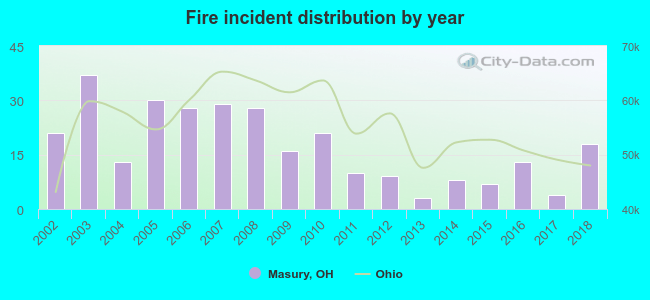 Based on the data from the years 2002 - 2018 the average number of fires per year is 17. The highest number of reported fire incidents - 37 took place in 2003, and the least - 3 in 2013. The data has a decreasing trend.
 Based on the reports from the years 2002 - 2018 the average number of fire-related yearly casualties is 0. The highest number of injuries - 3 took place in 2003, and the lowest - 0 in 2002. The data has an increasing trend.
 23.7% incidents where reported in the morning and 76.3% in the evening. The most fires (16.6%) took place on Saturday, and the least (12.2%) on Sunday.
 According to the 295 reports from years 2002 - 2018 most fires (11.5%) took place during April, and the least (4.7%) in January.
 Out of all 682 cases reported during the years 2002 - 2018, the most belonged to the categories: Fire (43.3%), Hazardous Condition (25.7%), and Service Call (12.5%).
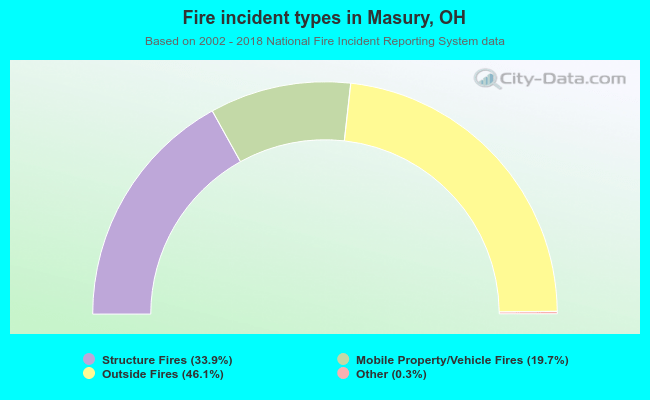 When looking into fire subcategories, the most reports belonged to: Outside Fires (46.1%), and Structure Fires (33.9%).