Mattawa: Fire Incidents, Washington (WA)
Where are fire incidents reported in Mattawa, WA
Something went wrong! Please refresh the page.
|
| |||||||||||||||||||||||||||||||||||||||||||||||||||||||||||||||||||||||||||||||||||||||||||||||||||||||||||||
| Other | 3 | |||||||||||||||||||||||||||||||||||||||||||||||||||||||||||||||||||||||||||||||||||||||||||||||||||||||||||||
2002 - 2018 National Fire Incident Reporting System (NFIRS) incidents
- Incident types reported to NFIRS in Mattawa, WA
- 40543.7%Fire
- 37039.9%Rescue & EMS
- 768.2%Good Intent Call
- 384.1%False Alarm
- 283.0%Hazardous Condition
- 80.9%Service Call
- 10.1%Overpressure Rupture
- 10.1%Special Incident
- Fire incident types reported to NFIRS in Mattawa, WA
- 27668.1%Outside Fires
- 6014.8%Mobile Property/Vehicle Fires
- 5212.8%Structure Fires
- 174.2%Other
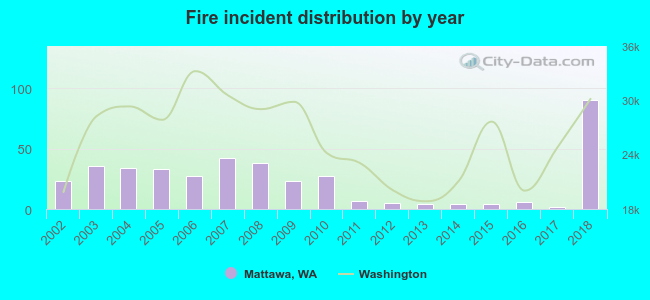 According to the data from the years 2002 - 2018 the average number of fires per year is 24. The highest number of reported fire incidents - 90 took place in 2018, and the least - 2 in 2017. The data has a growing trend.
 24.9% incidents where reported in the morning and 75.1% in the evening. The most fires (16.8%) took place on Monday, and the least (11.1%) on Tuesday.
 According to the 405 incident reports from years 2002 - 2018 most fires (28.1%) took place during July, and the least (2.2%) in November.
 Out of all 927 cases reported during the years 2002 - 2018, the most belonged to the categories: Fire (43.7%), Rescue & EMS (39.9%), and Good Intent Call (8.2%).
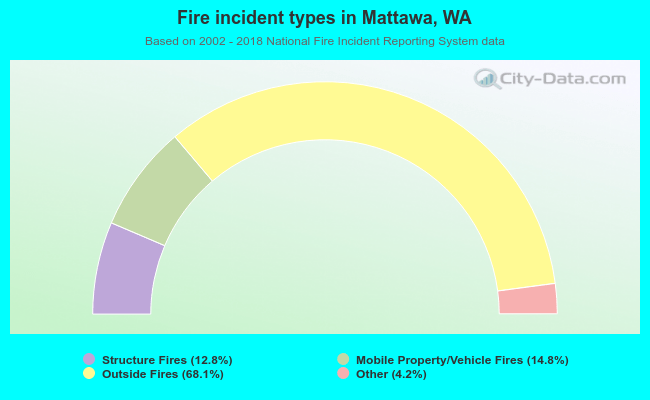 When looking into fire subcategories, the most reports belonged to: Outside Fires (68.1%), and Mobile Property/Vehicle Fires (14.8%).