| Fire incidents reported |
|---|
| Sreet name | Count |
|---|
| HIGHWAY 80 | 20 | | HWY 55 | 10 | | ST HWY AA | 10 | | STATE HIGHWAY AA | 10 | | 143 STATE HIGHWAY H | 8 | | FLYING J'S | 8 | | HWY 80 | 8 | | 143 STATE HWY H | 6 | | 609 RAILROAD | 6 | | CALVIN ST | 6 | | CTY ROAD 820 | 6 | | FLYING JS | 6 | | MM 58 HWY 55 | 6 | | MM 62 HIGHWAY 55 | 6 | | ST HWY AE | 6 | | TA TRUCKSTOP | 6 | | 101 CTY RD 606 | 4 | | 14242 HIGHWAY 61 | 4 | | 182 CLOVER LAWN | 4 | | 1887 HIGHWAY 61 | 4 | | CITY PARK | 4 | | COUNTY ROAD 711 | 4 | | HIGHWAY 55 MM 58 | 4 | | HIGHWAY V | 4 | | HWY 61 | 4 |
| | | Fire incidents reported |
|---|
| Sreet name | Count |
|---|
| HWY 61 AND HWY 80 | 4 | | LOVES TRUCKSTOP | 4 | | MAIN ST | 4 | | MM 58 HIGHWAY 55 | 4 | | MM 60 HWY 55 | 4 | | MOORE | 4 | | RAILROAD ST | 4 | | RIDGEVIEW | 4 | | STATE HWY V | 4 | | 1/2 NORTH OF HWY 80 AND HWY 61 | 2 | | 102 CLARK | 2 | | 102 HALL ST | 2 | | 103 GREEN ST | 2 | | 108 DEAN | 2 | | 112 RIDGEVIEW | 2 | | 1245 COUNTY ROAD AE | 2 | | 14 NANCE | 2 | | 143 ST HWY H | 2 | | 14440 HWY 61 | 2 | | 1450 STATE HWY HH | 2 | | 1471 STATE HWY V | 2 | | 15704 US HWY 61 | 2 | | 1711 CTY RD 711 | 2 | | 1800 ST HWY AA | 2 | | 1903 ST HWY AA | 2 |
|
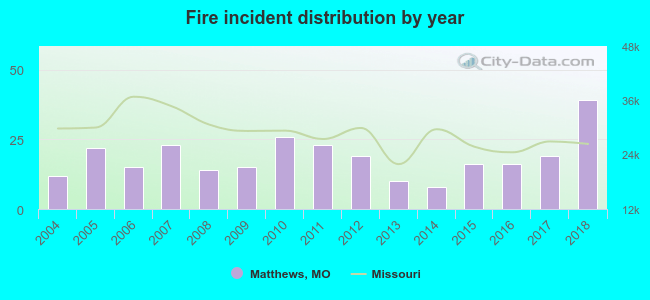 Based on the data from the years 2004 - 2018 the average number of fire incidents per year is 18. The highest number of reported fires - 39 took place in 2018, and the least - 8 in 2014. The data has a rising trend.
 26.7% incidents where reported in the morning and 73.3% in the evening. The most fires (17.7%) took place on Tuesday, and the least (11.2%) on Monday.
 According to the 277 incident reports from years 2004 - 2018 most fires (10.8%) took place during January, and the least (6.1%) in April.
 Out of all 791 cases reported during the years 2004 - 2018, the most belonged to the categories: Overpressure Rupture (42.5%), Fire (35.0%), and Service Call (10.1%).
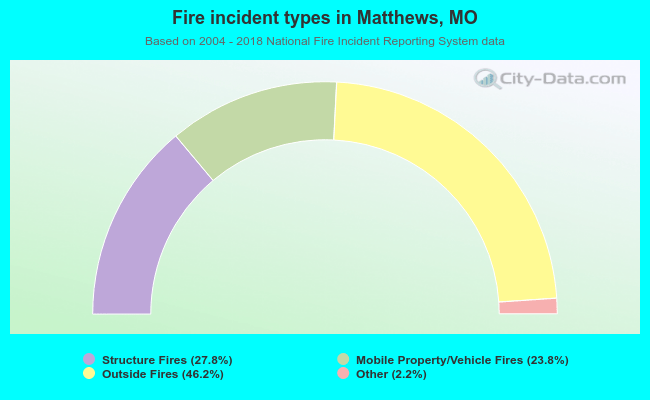 When looking into fire subcategories, the most reports belonged to: Outside Fires (46.2%), and Structure Fires (27.8%).