Mattituck: Fire Incidents, New York (NY)
Where are fire incidents reported in Mattituck, NY
Something went wrong! Please refresh the page.
|
| |||||||||||||||||||||||||||||||||||||||||||||||||||||||||||||||||||||||||||||||||||||||||||||||||||||||||||||
2003 - 2018 National Fire Incident Reporting System (NFIRS) incidents
- Incident types reported to NFIRS in Mattituck, NY
- 1,64972.3%Rescue & EMS
- 28612.5%False Alarm
- 1828.0%Fire
- 1094.8%Hazardous Condition
- 231.0%Service Call
- 200.9%Good Intent Call
- 60.3%Special Incident
- 40.2%Severe Weather
- Fire incident types reported to NFIRS in Mattituck, NY
- 7943.4%Structure Fires
- 6234.1%Outside Fires
- 2714.8%Mobile Property/Vehicle Fires
- 147.7%Other
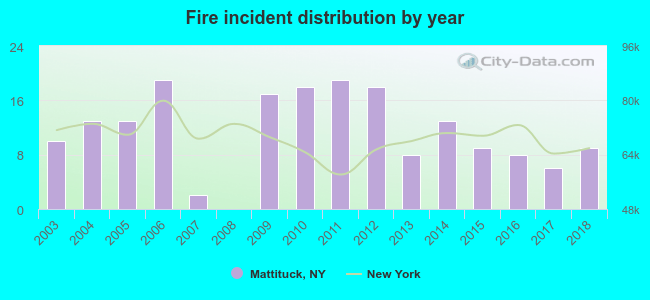 Based on the data from the years 2003 - 2018 the average number of fire incidents per year is 11. The highest number of reported fire incidents - 19 took place in 2006, and the least - 0 in 2008. The data has a declining trend.
 31.3% incidents where reported in the morning and 68.7% in the evening. The most fires (18.1%) took place on Tuesday, and the least (9.9%) on Sunday.
 According to the 182 incident reports from years 2003 - 2018 most fires (11.5%) took place during October, and the least (4.9%) in February.
 Out of all 2,281 cases reported during the years 2003 - 2018, the most belonged to the categories: Rescue & EMS (72.3%), False Alarm (12.5%), and Fire (8.0%).
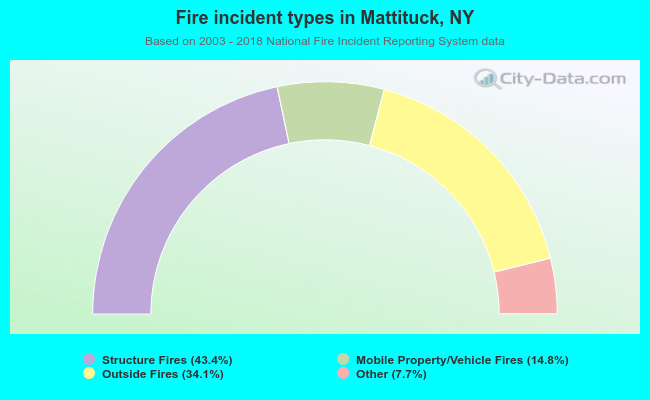 When looking into fire subcategories, the most reports belonged to: Structure Fires (43.4%), and Outside Fires (34.1%).