| Fire incidents reported |
|---|
| Sreet name | Count |
|---|
| CASTLETON RD | 50 | | FORT CHISWELL RD | 26 | | PEPPERS FERRY RD | 16 | | LEE HWY | 14 | | SMITH ROAD | 12 | | I77 | 10 | | MAJOR GRAHAMS RD | 10 | | FACTORY OUTLET DR | 8 | | PEPPERS FERRY RD | 8 | | SMITH RD | 8 | | 614 RICKY RD | 6 | | FORT CHISWELL RD | 6 | | GROUSE RIDGE RD | 6 | | I81 SB | 6 | | MAJESTIC DR | 6 | | 105 BROCK AVE | 4 | | 127 FACTORY MERCHANTS DR | 4 | | 427 LANCER LANE | 4 | | 427 LANCER LN | 4 | | 7755 PEPPERS FERRY ROAD | 4 | | BAKER ISLAND RD | 4 | | CHAPMAN RD | 4 | | CHAPMAN RD | 4 | | DANNER ROAD | 4 | | EXIT 80 FLYING J | 4 |
| | | Fire incidents reported |
|---|
| Sreet name | Count |
|---|
| FOSTER FALLS RD | 4 | | GROUSE RIDGE RD | 4 | | HONEYTREE LN | 4 | | I - 77 NB 27.5 MM | 4 | | I - 77 NB 32MM | 4 | | I - 81 NB 84 MM | 4 | | I - 81 SB EXIT 80 | 4 | | I77 NB | 4 | | I77 NORTH BOUND | 4 | | I81 NB | 4 | | INTERSTATE 77 | 4 | | IVANHOE RD | 4 | | LUMBER LN | 4 | | MILLERS CREEK RD | 4 | | PAULEY FLATWOOD RD | 4 | | PAYNE TOWN RD | 4 | | RAMSEY MNT ROAD | 4 | | WHISPERING PINES RD | 4 | | 1/10 MILE PAST MAJOR GRAHAMMS | 2 | | 100 FORT CHISWELL RD | 2 | | 102 PAULEY FLATWOODS RD | 2 | | 103 SMYTH RD | 2 | | 1031 RAMSEY MOUNTAIN RD | 2 | | 104 KEESLING SCHOOL RD | 2 | | |
|
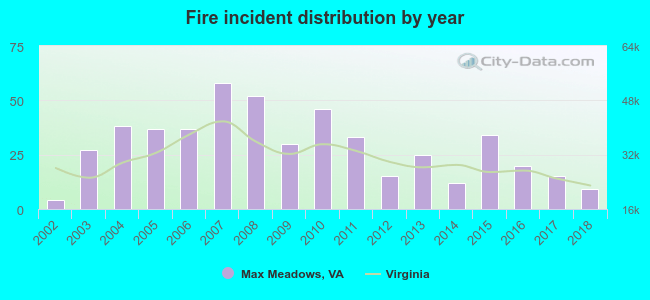 Based on the data from the years 2002 - 2018 the average number of fires per year is 29. The highest number of fire incidents - 58 took place in 2007, and the least - 4 in 2002. The data has a rising trend.
 According to the data from the years 2002 - 2018 the average number of fire-related yearly casualties is 0. The highest number of injuries - 2 took place in 2007, and the lowest - 0 in 2002. The data has a constant trend.
 28.9% incidents where reported in the morning and 71.1% in the evening. The most fires (15.2%) took place on Wednesday, and the least (13.0%) on Monday.
 Based on the 492 fire incident reports from years 2002 - 2018 most fires (13.6%) took place during February, and the least (4.9%) in September.
 Out of all 1,238 cases reported during the years 2002 - 2018, the most belonged to the categories: Fire (39.7%), Rescue & EMS (27.1%), and Overpressure Rupture (13.5%).
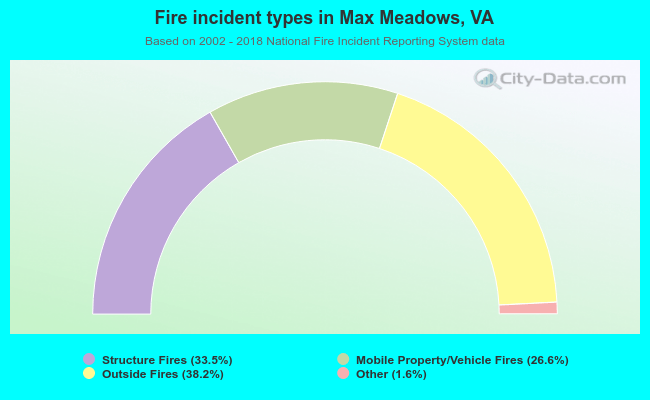 When looking into fire subcategories, the most reports belonged to: Outside Fires (38.2%), and Structure Fires (33.5%).