| Fire incidents reported |
|---|
| Sreet name | Count |
|---|
| I17 | 182 | | SR 69 | 34 | | BLACK MOUNTAIN RD | 12 | | STATE ROUTE 69 | 12 | | CONESTOGA DR | 10 | | QUAIL RUN DR | 10 | | INDIAN BEND DR | 8 | | LARRY LN | 8 | | SPRING LN | 8 | | CACTUS WREN DR | 6 | | CORDES LAKES DR | 6 | | FREMONT DR | 6 | | MARBLE CANYON WAY | 6 | | MONTE VISTA RD | 6 | | ORME SCHOOL RD | 6 | | PANORAMA DR | 6 | | STAGECOACH TRL | 6 | | ZARAGOZA DR | 6 | | ANTELOPE CREEK RD | 4 | | BLOODY BASIN EAST RD | 4 | | CHOLLA DR | 4 | | CORDES LAKES RD | 4 | | DEER VALLEY LN | 4 | | FIFTH ST | 4 | | HITCHING POST WAY | 4 |
| | | Fire incidents reported |
|---|
| Sreet name | Count |
|---|
| MINGUS DR | 4 | | OCOTILLO DR | 4 | | OLD SYCAMORE RD | 4 | | RED ROCK LN | 4 | | SAGUARO DR | 4 | | SOLEIL DOWN RD | 4 | | STAGECOACH RD | 4 | | AGUA FRIA AVE | 2 | | ALBINS WAY | 2 | | ANTELOPE RD | 2 | | ARROYO LN | 2 | | AUSTIN LN | 2 | | AZTEC TRL | 2 | | BEAR CANYON RD | 2 | | BEAVER CREEK RD | 2 | | BLACK CANYON CITY LANDFIL RD | 2 | | BLACK ROCK TRL | 2 | | BOB WHITE RD | 2 | | BORDER ST | 2 | | CEDAR CANYON DR | 2 | | CEDAR DR | 2 | | CENTRAL AVE | 2 | | CROSS L RD | 2 | | DUFFERS DR | 2 | | |
|
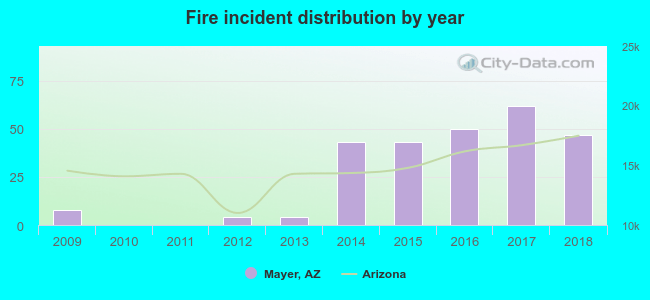 According to the data from the years 2009 - 2018 the average number of fires per year is 26. The highest number of reported fires - 62 took place in 2017, and the least - 0 in 2010. The data has a rising trend.
 31.4% incidents where reported in the morning and 68.6% in the evening. The most fires (19.5%) took place on Friday, and the least (9.6%) on Sunday.
 Based on the 261 reports from years 2009 - 2018 most fires (11.9%) took place during June, and the least (5.7%) in October.
 Out of all 5,552 cases reported during the years 2009 - 2018, the most belonged to the categories: Rescue & EMS (70.9%), Service Call (11.9%), and Good Intent Call (7.3%).
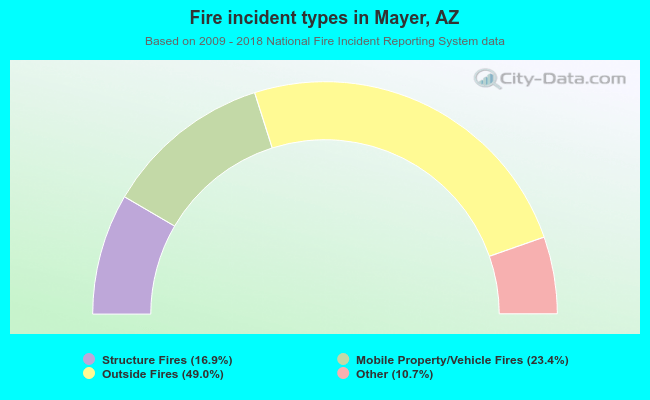 When looking into fire subcategories, the most incidents belonged to: Outside Fires (49.0%), and Mobile Property/Vehicle Fires (23.4%).