| Fire incidents reported |
|---|
| Sreet name | Count |
|---|
| SR 20 | 30 | | US 27 | 10 | | SR 51 | 8 | | CR 53 | 6 | | SR 20 WEST | 6 | | VIOLET | 6 | | 136 SW SAN PEDRO AVE | 4 | | CR 251 | 4 | | CR 354 | 4 | | CR 360 | 4 | | HWY 27 | 4 | | HWY 27 WEST | 4 | | MALONE AVE. | 4 | | PINE STREET | 4 | | WORTH CALHOUN | 4 | | 115 SE LAND AVE | 2 | | 119 NE NORTHRIDGE RD | 2 | | 1236 NE CR 353 | 2 | | 126 SE LAND AVE | 2 | | 1336 NW MERIDAN RD | 2 | | 168 NW MEDITERRANEAN RD | 2 | | 1815 NE FOYE OSTEEN LANE | 2 | | 200 E MAIN | 2 | | 201 SW WILLOW ST | 2 | | 227 E MAIN ST | 2 |
| | | Fire incidents reported |
|---|
| Sreet name | Count |
|---|
| 230 INDUSTRIAL CIRCLE | 2 | | 232 SE INDUSTRIAL PARK CIRCLE | 2 | | 234 SW HARTLAND LANE | 2 | | 237 SW CR 300 | 2 | | 242 SW ALACHUA AVE | 2 | | 253 SE TIGER RD | 2 | | 257 SW JEFFERSON LANE | 2 | | 300 SE CLYDE AVE | 2 | | 336 NE HOLLYWOOD BLVD | 2 | | 359 SE CIRCLE DR | 2 | | 359 SE CIRCLE DRIVE | 2 | | 391 E. MAIN ST. SR 27 | 2 | | 407SW PINE ST. | 2 | | 475 HART AVE. | 2 | | 506 OAK STREET | 2 | | 51 HWY | 2 | | 51 SOUTH TO AL CREEK ROAD | 2 | | 512 WEST MAIN | 2 | | 53 ( HIGHLANDS ROAD) | 2 | | 530 ALACHUA AVE | 2 | | 611 N.E PECAN STREET | 2 | | 641 LAUREL ST. | 2 | | 669 N SR 51 | 2 | | 673 MLK ST. | 2 | | |
|
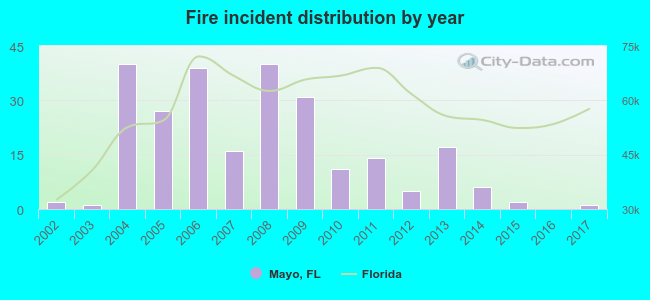 According to the data from the years 2002 - 2017 the average number of fire incidents per year is 16. The highest number of reported fires - 40 took place in 2004, and the least - 0 in 2016. The data has a decreasing trend.
 27.8% incidents where reported in the morning and 72.2% in the evening. The most fires (17.1%) took place on Wednesday, and the least (9.9%) on Friday.
 Based on the 252 fire incidents from years 2002 - 2017 most fires (13.9%) took place during January, and the least (4.4%) in August.
 Out of all 372 cases reported during the years 2002 - 2017, the most belonged to the categories: Fire (67.7%), Rescue & EMS (19.9%), and Overpressure Rupture (9.7%).
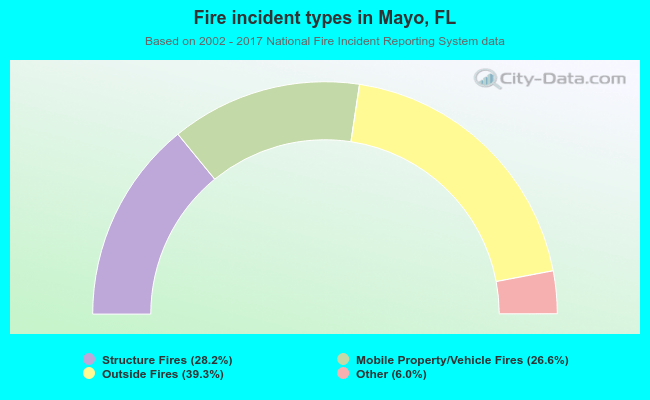 When looking into fire subcategories, the most incidents belonged to: Outside Fires (39.3%), and Structure Fires (28.2%).