Maypearl: Fire Incidents, Texas (TX)
Where are fire incidents reported in Maypearl, TX
Something went wrong! Please refresh the page.
|
| |||||||||||||||||||||||||||||||||||||||||||||||||||||||||||||||||||||||||||||||||||||||||||||||||||||||||||||
| Other | 54 | |||||||||||||||||||||||||||||||||||||||||||||||||||||||||||||||||||||||||||||||||||||||||||||||||||||||||||||
2002 - 2018 National Fire Incident Reporting System (NFIRS) incidents
- Incident types reported to NFIRS in Maypearl, TX
- 53542.5%Rescue & EMS
- 46436.9%Fire
- 1028.1%Good Intent Call
- 725.7%Hazardous Condition
- 544.3%Service Call
- 181.4%False Alarm
- 90.7%Special Incident
- 40.3%Overpressure Rupture
- Fire incident types reported to NFIRS in Maypearl, TX
- 30766.2%Outside Fires
- 8919.2%Structure Fires
- 357.5%Mobile Property/Vehicle Fires
- 337.1%Other
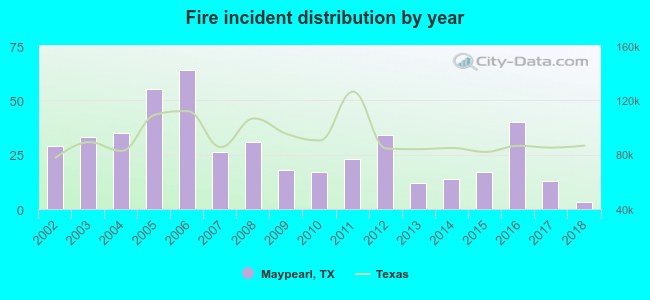 Based on the data from the years 2002 - 2018 the average number of fire incidents per year is 27. The highest number of fire incidents - 64 took place in 2006, and the least - 3 in 2018. The data has a decreasing trend.
 24.6% incidents where reported in the morning and 75.4% in the evening. The most fires (18.1%) took place on Monday, and the least (11.2%) on Tuesday.
 Based on the 464 reports from years 2002 - 2018 most fires (13.6%) took place during August, and the least (4.3%) in May.
 Out of all 1,259 cases reported during the years 2002 - 2018, the most belonged to the categories: Rescue & EMS (42.5%), Fire (36.9%), and Good Intent Call (8.1%).
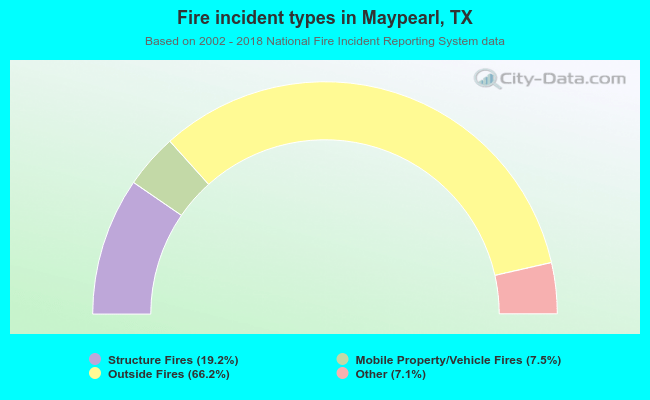 When looking into fire subcategories, the most incidents belonged to: Outside Fires (66.2%), and Structure Fires (19.2%).