McCrory: Fire Incidents, Arkansas (AR)
Where are fire incidents reported in McCrory, AR
Something went wrong! Please refresh the page.
|
| |||||||||||||||||||||||||||||||||||||||||||||||||||||||||||||||||||||||||||||||||||||||||||||||||||||||||||||
| Other | 66 | |||||||||||||||||||||||||||||||||||||||||||||||||||||||||||||||||||||||||||||||||||||||||||||||||||||||||||||
2004 - 2018 National Fire Incident Reporting System (NFIRS) incidents
- Incident types reported to NFIRS in McCrory, AR
- 49087.2%Fire
- 325.7%Hazardous Condition
- 213.7%Rescue & EMS
- 61.1%Overpressure Rupture
- 50.9%Good Intent Call
- 40.7%False Alarm
- 30.5%Service Call
- 10.2%Severe Weather
- Fire incident types reported to NFIRS in McCrory, AR
- 29560.2%Outside Fires
- 12224.9%Structure Fires
- 408.2%Mobile Property/Vehicle Fires
- 336.7%Other
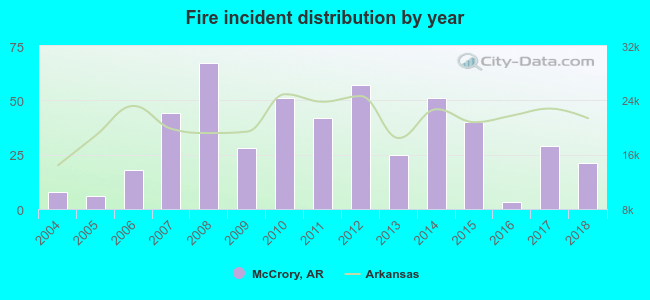 According to the data from the years 2004 - 2018 the average number of fires per year is 33. The highest number of reported fires - 67 took place in 2008, and the least - 3 in 2016. The data has an increasing trend.
 26.3% incidents where reported in the morning and 73.7% in the evening. The most fires (16.5%) took place on Tuesday, and the least (12.2%) on Friday.
 According to the 490 incident reports from years 2004 - 2018 most fires (10.4%) took place during February, and the least (4.3%) in December.
 Out of all 562 cases reported during the years 2004 - 2018, the most belonged to the categories: Fire (87.2%), Hazardous Condition (5.7%), and Rescue & EMS (3.7%).
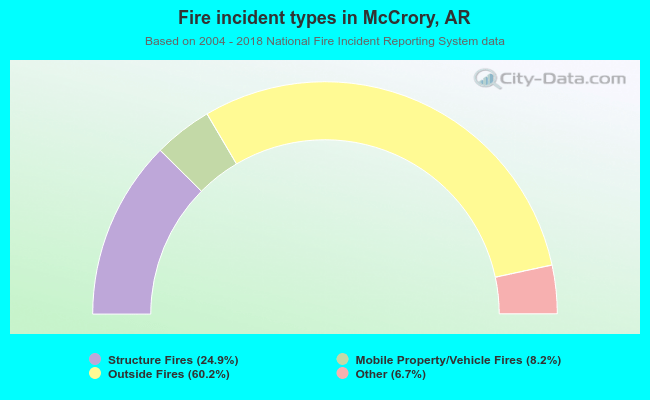 When looking into fire subcategories, the most incidents belonged to: Outside Fires (60.2%), and Structure Fires (24.9%).