| Fire incidents reported |
|---|
| Sreet name | Count |
|---|
| HWY 65 SOUTH HWY | 8 | | FIRST ST | 6 | | THIRD ST | 6 | | 1210 HWY 65 SOUTH, LOT 24 | 4 | | 4 MILE CREEK ROAD RD | 4 | | 415 SOUTH FIFTH STREET ST | 4 | | COTTON PATCH RD | 4 | | GRANDVIEW | 4 | | HWY 1 NORTH | 4 | | HWY 65 NORTH | 4 | | NORTH 4TH | 4 | | SOUTH FIRST ST | 4 | | #13 PAUL STREET ST | 2 | | #3 ADCOCK CIRCLE CIR | 2 | | #5 FAIRVIEW DRIVE DR | 2 | | #9 SHANNON DRIVE ST | 2 | | 10 JACKSON DRIVE DR | 2 | | 10 JACKSON ST | 2 | | 100 OAKLAND STREET ST | 2 | | 1000 NORTH THIRD STREET ST | 2 | | 1001 MASONVILLE ROAD RD | 2 | | 101 SHERWOOD ST | 2 | | 1010 HEMLOCK ST | 2 | | 105 MEADOW ROAD RD | 2 | | 105 WEST BEECH STREET ST | 2 |
| | | Fire incidents reported |
|---|
| Sreet name | Count |
|---|
| 107 JEFFERSON STREET ST | 2 | | 109 JEFFERSON STREET ST | 2 | | 109 PARK STREET ST | 2 | | 110 SOUTH ADAMS ST | 2 | | 111 JEFFERSON STREET ST | 2 | | 111 TURNER NEAL ROAD RD | 2 | | 114 S AND P ST | 2 | | 114 SHERMAN STREET ST | 2 | | 114 SOUTH FIFTH STREET ST | 2 | | 115 CARVER STREET ST | 2 | | 1202 SOUTH RAILROAD STREET ST | 2 | | 1210 HWY 65 SOUTH HWY | 2 | | 1216 HIGHLAND | 2 | | 124 VIRGINIA ST ST | 2 | | 13 PLAINVIEW | 2 | | 1300 BUSH STREET ST | 2 | | 1300 BUSH STREET STS | 2 | | 1324 BUSH STREET ST | 2 | | 1350 GRANDVIEW | 2 | | 138 BELEFORD ROAD | 2 | | 1508 SHERLAND ST | 2 | | 159 HWY | 2 | | 16 SHANNON DRIVE DR | 2 | | 18 SHANNON DRIVE DR | 2 | | 181 HWY 159 SOUTH | 2 |
|
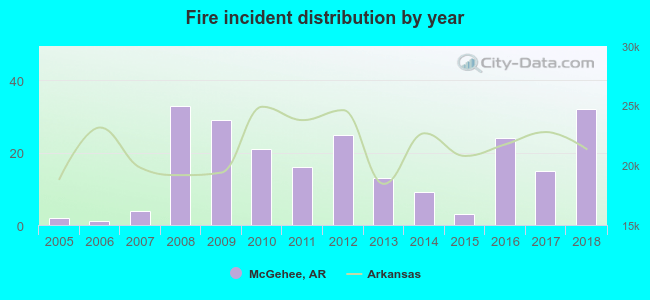 According to the data from the years 2005 - 2018 the average number of fires per year is 16. The highest number of reported fires - 33 took place in 2008, and the least - 1 in 2006. The data has an increasing trend.
 According to the reports from the years 2005 - 2018 the average number of fire-related fatalities per year is 0. The highest number of reported deaths - 2 took place in 2012, and the lowest - 0 in 2005. The data has a constant trend.
 37.9% incidents where reported in the morning and 62.1% in the evening. The most fires (18.9%) took place on Friday, and the least (10.6%) on Tuesday.
 According to the 227 fires from years 2005 - 2018 most fires (12.3%) took place during March, and the least (3.1%) in November.
 Out of all 284 cases reported during the years 2005 - 2018, the most belonged to the categories: Fire (79.9%), Good Intent Call (13.4%), and Rescue & EMS (2.1%).
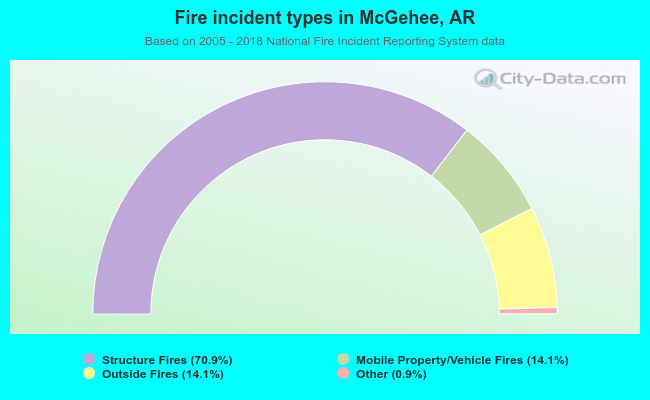 When looking into fire subcategories, the most incidents belonged to: Structure Fires (70.9%), and Mobile Property/Vehicle Fires (14.1%).