| Fire incidents reported |
|---|
| Sreet name | Count |
|---|
| ROUTE 41 | 40 | | CORTLANDVILLE MUTUAL AID | 30 | | TOWNLINE RD | 26 | | MCGRAW-MARATHON RD | 18 | | MAYBURY RD | 16 | | NORTH RD | 14 | | NORTH ST | 14 | | SOUTH ST | 14 | | CINCINNATUS MUTUAL AID | 10 | | CLINTON ST | 10 | | CLINTON ST. EXT | 10 | | STILLWELL RD | 10 | | CENTER RD | 8 | | CHARLES ST | 8 | | HOMER MUTUAL AID | 8 | | MCGRAWMARATHON RD | 8 | | N TOWER RD | 8 | | SPRING ST | 8 | | STRAMBA RD | 8 | | W ACADEMY ST | 8 | | W MAIN ST | 8 | | MAIN ST | 6 | | MAIN ST | 6 | | RIDGE RD | 6 | | ROUTE 11 | 6 |
| | | Fire incidents reported |
|---|
| Sreet name | Count |
|---|
| TELEPHONE RD | 6 | | CLINTON ST EXT | 4 | | E ACADEMY ST | 4 | | EAST AVE | 4 | | HICKS HILL RD | 4 | | MUTUAL AID TO HOMER | 4 | | MUTUAL AID TO MARATHON | 4 | | OK ST | 4 | | POTTER RD | 4 | | ROUTE 81 | 4 | | SOSHINSKY HILL RD | 4 | | W CENTER ST | 4 | | . | 2 | | 41 RT | 2 | | BLODGETT MILLS RD | 2 | | CARR HILL RD. | 2 | | CENTER ST | 2 | | CLINTON ST | 2 | | CLINTON ST EXT | 2 | | CLINTON STREET | 2 | | CORTLAND CITY MUTUAL AID | 2 | | EAST FREETOWN RD | 2 | | EAST FREETOWN TEXAS VALY RD | 2 | | HARRIS RD | 2 | | |
|
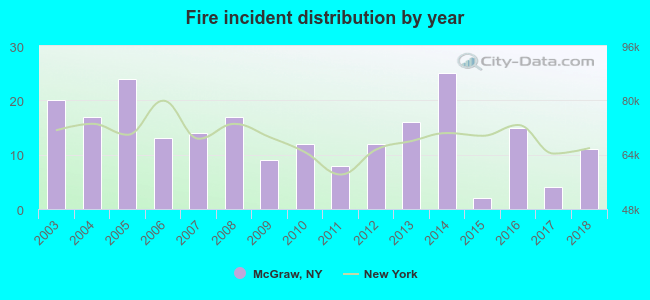 Based on the data from the years 2003 - 2018 the average number of fire incidents per year is 14. The highest number of fires - 25 took place in 2014, and the least - 2 in 2015. The data has a decreasing trend.
 30.1% incidents where reported in the morning and 69.9% in the evening. The most fires (20.1%) took place on Sunday, and the least (9.6%) on Thursday.
 According to the 219 reports from years 2003 - 2018 most fires (11.9%) took place during November, and the least (4.1%) in September.
 Out of all 1,121 cases reported during the years 2003 - 2018, the most belonged to the categories: Overpressure Rupture (36.0%), Fire (19.5%), and Rescue & EMS (16.4%).
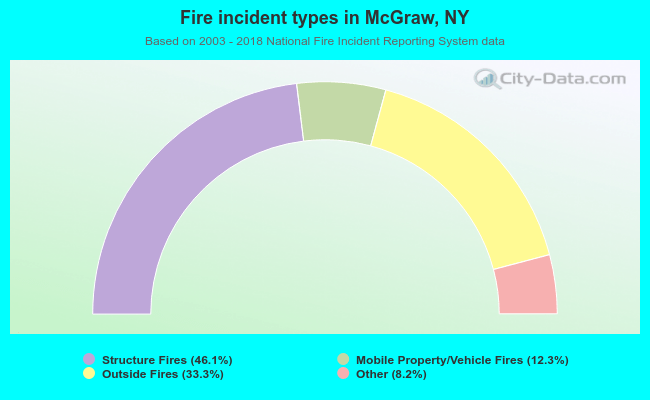 When looking into fire subcategories, the most incidents belonged to: Structure Fires (46.1%), and Outside Fires (33.3%).