| Fire incidents reported |
|---|
| Sreet name | Count |
|---|
| WASHINGTON RD | 44 | | MCMURRAY RD | 16 | | CENTER CHURCH RD | 8 | | BEBOUT RD | 6 | | BUCKEYE ST | 6 | | THOMPSONVILLE RD | 6 | | CEDAR HILL DR | 4 | | EDGAR LN | 4 | | GALLERY DR | 4 | | HIDDEN VALLEY RD | 4 | | JUSTABOUT RD | 4 | | LEXINGTON DR | 4 | | OAKHURST DR | 4 | | SCENIC RIDGE DR | 4 | | SPRING ST | 4 | | VALLEY BROOK RD | 4 | | WOODSIDE DR | 4 | | 1009 WATERDAM PLAZA DRIVE | 2 | | 3150 WASHINGTON ROAD | 2 | | 455 EAST MCMURRAY ROAD | 2 | | ABBYBROOK | 2 | | AUTUMN WAY | 2 | | BITTERSWEET CIR | 2 | | BOWER HILL RD | 2 | | BOWER HILL RD | 2 |
| | | Fire incidents reported |
|---|
| Sreet name | Count |
|---|
| BREMEN LN | 2 | | BROOKWOOD RD | 2 | | BUCKINGHAM DR | 2 | | BUNKER HILL DR | 2 | | CAMELFORD RD | 2 | | CARRIAGE HILL DR | 2 | | CENTER CHURCH ROAD | 2 | | COPPOLA | 2 | | DEERFIELD DR | 2 | | DRIFTWOOD DR | 2 | | DRUID DR | 2 | | EDGEWOOD DR | 2 | | EVANS DR | 2 | | FAIRVIEW CIR | 2 | | FOREST DR | 2 | | FOX RUN DR | 2 | | FRANKLIN DR | 2 | | FROSTY | 2 | | GREEN VALLEY | 2 | | HAWTHORNE | 2 | | HAYS RD | 2 | | HEMLOCK DR | 2 | | HUNTING CREEK RD | 2 | | JOHNSTON RD | 2 | | JONATHAN DR | 2 |
|
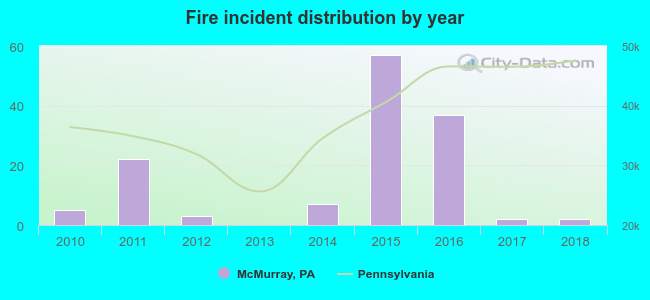 According to the data from the years 2010 - 2018 the average number of fire incidents per year is 15. The highest number of fires - 57 took place in 2015, and the least - 0 in 2013. The data has a declining trend.
 30.4% incidents where reported in the morning and 69.6% in the evening. The most fires (18.5%) took place on Saturday, and the least (11.1%) on Tuesday.
 Based on the 135 incident reports from years 2010 - 2018 most fires (11.1%) took place during June, and the least (3.7%) in March.
 Out of all 1,292 cases reported during the years 2010 - 2018, the most belonged to the categories: Hazardous Condition (23.3%), Rescue & EMS (19.8%), and Good Intent Call (19.7%).
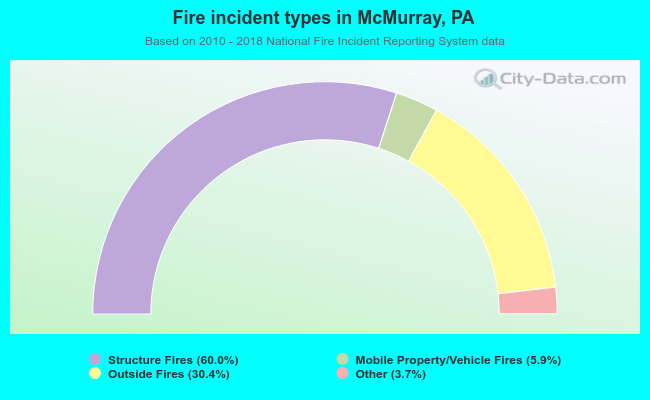 When looking into fire subcategories, the most incidents belonged to: Structure Fires (60.0%), and Outside Fires (30.4%).