| Fire incidents reported |
|---|
| Sreet name | Count |
|---|
| FM 725 | 50 | | FM 78 | 26 | | TERMINAL LOOP | 22 | | TERMINAL LOOP RD | 12 | | TERMINAL LOOP | 8 | | GALLAGHER RD | 6 | | MCQUEENEY RD | 6 | | SKI LODGE ROAD | 6 | | WOODLAKE DR | 6 | | HAPPY HAVEN RD | 4 | | LAKE CREEK | 4 | | LAKESIDE PASS | 4 | | LAKEVIEW TRL | 4 | | OLD MCQUEENEY ROAD | 4 | | OLD SAN ANTONIO RD | 4 | | PECAN | 4 | | PECAN DRIVE SW | 4 | | PIONEER RD | 4 | | RIDGE ROAD DRIVE | 4 | | SHADYLON | 4 | | SHORTCUT RD | 4 | | SPYGLASS RD | 4 | | STEEL MILL DRIVE | 4 | | TERMINAL LOOP DR | 4 | | TERMINAL LOOP RD | 4 |
| | | Fire incidents reported |
|---|
| Sreet name | Count |
|---|
| WOODCREEK CIR | 4 | | YOUNGSFORD | 4 | | 1000 BLOCK OF WOSNIG RD | 2 | | 10500 BLOCK OF FM 725 | 2 | | 2100 BLOCK TERMINAL LOOP | 2 | | 500 BLOCK HOT SHOT LANE | 2 | | 620 BLOCK OF GALLAGHER R | 2 | | 9000 BLOCK OF FM 725 | 2 | | ADMIRAL BENBO LANE | 2 | | ADMIRAL BENBOW | 2 | | ADMIRAN BENBOW | 2 | | ALLEN | 2 | | ALLEN ST | 2 | | BEHIND 8820 FM 725 | 2 | | BLOCK YOUNGSFORD RD | 2 | | BLOCK, YOUNGSFORD RD | 2 | | BREEZY HILL LANE | 2 | | BRIDGE RD | 2 | | BRIDGE RD | 2 | | BRIDGE ROAD AT RIVER | 2 | | CORNER OF ROCK DOVE | 2 | | DANIELLE ALY | 2 | | ELM DR | 2 | | ELM DRIVE | 2 | | ELM ST | 2 |
|
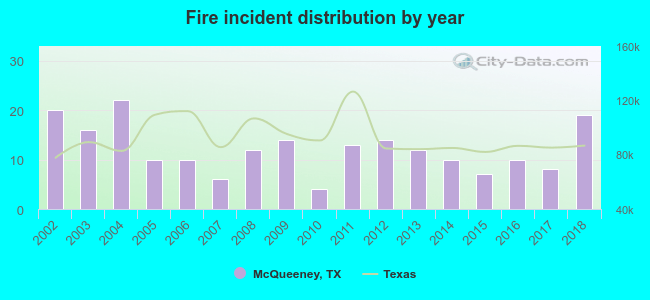 Based on the data from the years 2002 - 2018 the average number of fire incidents per year is 12. The highest number of fire incidents - 22 took place in 2004, and the least - 4 in 2010. The data has a dropping trend.
 According to the data from the years 2002 - 2018 the average number of fire-related yearly casualties is 0. The highest number of casualties - 4 took place in 2002, and the lowest - 0 in 2003. The data has a decreasing trend.
 28.5% incidents where reported in the morning and 71.5% in the evening. The most fires (17.4%) took place on Tuesday, and the least (12.1%) on Thursday.
 Based on the 207 reports from years 2002 - 2018 most fires (13.0%) took place during August, and the least (3.9%) in September.
 Out of all 2,098 cases reported during the years 2002 - 2018, the most belonged to the categories: Rescue & EMS (63.6%), Good Intent Call (10.0%), and Fire (9.9%).
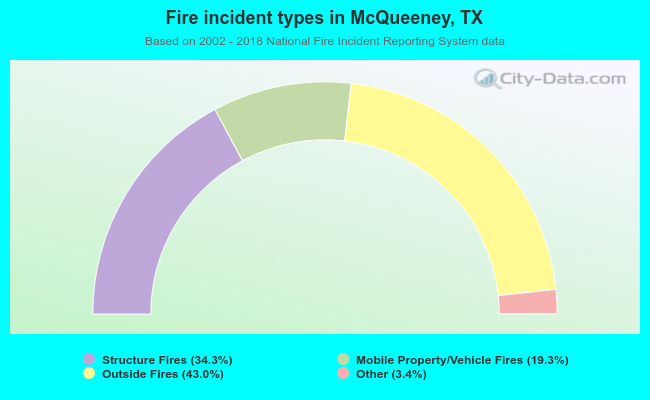 When looking into fire subcategories, the most reports belonged to: Outside Fires (43.0%), and Structure Fires (34.3%).