Meadville: Fire Incidents, Pennsylvania (PA)
Where are fire incidents reported in Meadville, PA
Something went wrong! Please refresh the page.
| Fire incidents reported | |
|---|---|
| Sreet name | Count |
| PARK AVE | 114 |
| PARK AVE | 72 |
| MAIN ST | 66 |
| MARKET ST | 56 |
| CONNEAUT LAKE RD | 48 |
| ALBRIGHT DR | 46 |
| CHESTNUT ST | 38 |
| JEFFERSON ST | 36 |
| MARKET ST | 34 |
| SPRING ST | 30 |
| CHESTNUT ST | 28 |
| DOGWOOD DR | 28 |
| ALBRIGHT DR | 26 |
| CUSSEWAGO RD | 26 |
| MAIN ST | 26 |
| NORTH ST | 26 |
| MERCER PIKE | 22 |
| PENNSYLVANIA AVE | 22 |
| PERRY HIGHWAY | 22 |
| BALDWIN ST | 20 |
| JEFFERSON ST | 20 |
| MILL ST | 20 |
| SPRING ST | 20 |
| WALNUT ST | 20 |
| WILLOW ST | 20 |
| ARCH ST | 18 |
| LIBERTY ST | 18 |
| WATER ST | 18 |
| ASBURY MANOR EAST MHP | 16 |
| DOGWOOD DR | 16 |
| Other | 403 |
2007 - 2018 National Fire Incident Reporting System (NFIRS) incidents
- Incident types reported to NFIRS in Meadville, PA
- 1,37529.2%Fire
- 1,12423.9%Rescue & EMS
- 83317.7%Hazardous Condition
- 63213.4%Service Call
- 48710.4%False Alarm
- 1723.7%Good Intent Call
- 491.0%Severe Weather
- 270.6%Special Incident
- 50.1%Overpressure Rupture
- Fire incident types reported to NFIRS in Meadville, PA
- 67849.3%Structure Fires
- 34124.8%Other
- 25618.6%Outside Fires
- 1007.3%Mobile Property/Vehicle Fires
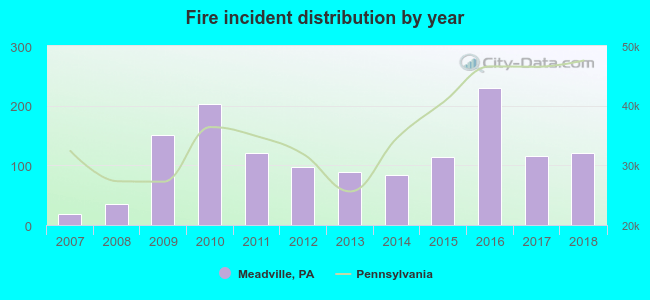 According to the data from the years 2007 - 2018 the average number of fire incidents per year is 115. The highest number of fires - 230 took place in 2016, and the least - 19 in 2007. The data has a rising trend.
The average number of yearly fire incidents per 10k residents in Meadville, PA compared to nearest cities:
(Note: Based on data for the last 3 years, including only cities with population 5,000 and above)
| Meadville: | 117.1 |
| Edinboro: | 35.7 |
| Greenville: | 134.0 |
| Sugarcreek: | 7.1 |
| Franklin: | 36.2 |
| Titusville: | 66.4 |
| Oil City: | 35.2 |
| Corry: | 38.7 |
| Hermitage: | 27.9 |
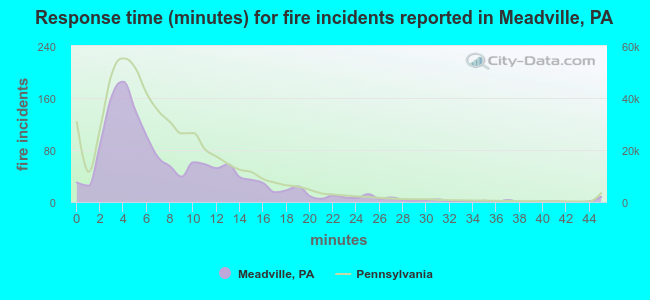 The median response time based on all reported fire incidents is 6 minutes. This is comparable to the Pennsylvania median value.
The median response time in Meadville, PA compared to nearest cities:
(Note: Based on data for all years, including only cities with at least 500 fire incidents)
| Meadville: | 6 minutes |
| Greenville: | 6 minutes |
| Andover: | 10 minutes |
| Franklin: | 5 minutes |
| Oil City: | 4 minutes |
| Conneaut: | 5 minutes |
| Erie: | 5 minutes |
| Jefferson: | 10 minutes |
| Grove City: | 10 minutes |
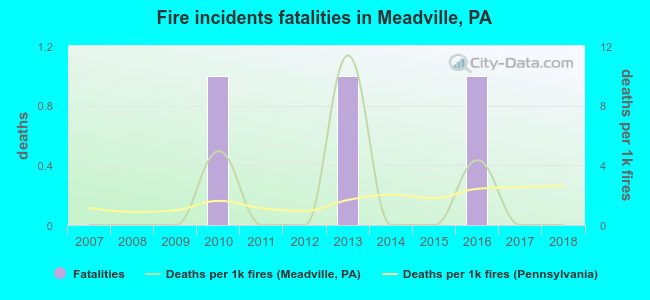 Based on the data from the years 2007 - 2018 the average number of fire-related yearly deaths is 0. The highest number of reported deaths - 1 took place in 2010, and the lowest - 0 in 2007. The data has a constant trend.
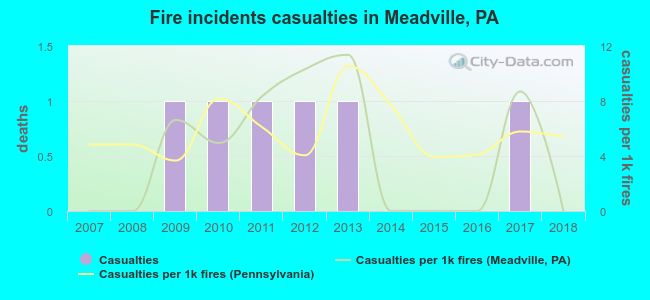 According to the reports from the years 2007 - 2018 the average number of fire-related casualties per year is 1. The highest number of injuries - 1 took place in 2009, and the lowest - 0 in 2007. The data has a constant trend.
The average number of injuries per 1,000 fires is 4. This indicator was the highest - 11 in 2013, and the lowest 0 in 2007. The trend for injuries per 1,000 fires is rising. Compared to the state value the number of casualties per 1,000 incidents is lower.
According to the reports from the years 2007 - 2018 the average number of fire-related casualties per year is 1. The highest number of injuries - 1 took place in 2009, and the lowest - 0 in 2007. The data has a constant trend.
The average number of injuries per 1,000 fires is 4. This indicator was the highest - 11 in 2013, and the lowest 0 in 2007. The trend for injuries per 1,000 fires is rising. Compared to the state value the number of casualties per 1,000 incidents is lower.Casualties per 1,000 incidents in Meadville, PA compared to nearest cities:
(Note: Based on data for all years, including only cities with at least 500 fire incidents)
| Meadville: | 4.4 |
| Greenville: | 10.5 |
| Andover: | 0.0 |
| Franklin: | 7.5 |
| Oil City: | 12.8 |
| Conneaut: | 17.8 |
| Erie: | 8.0 |
| Jefferson: | 4.0 |
| Grove City: | 2.0 |
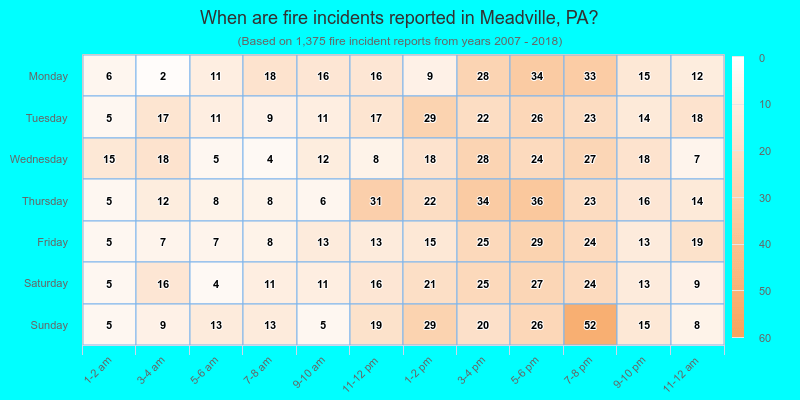
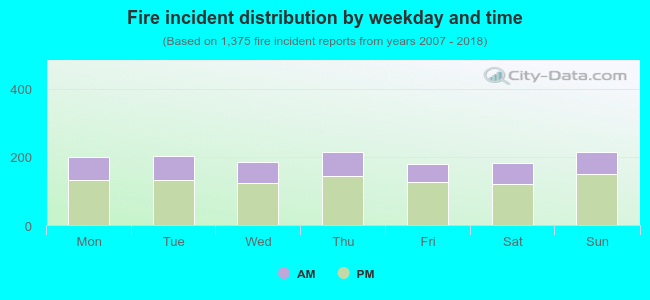 32.8% incidents where reported in the morning and 67.2% in the evening. The most fires (15.6%) took place on Thursday, and the least (12.9%) on Friday.
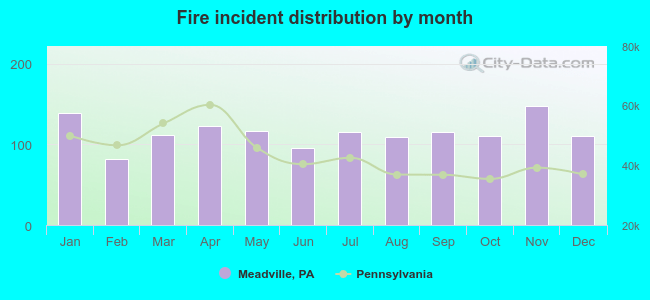 According to the 1,375 fire incident reports from years 2007 - 2018 most fires (10.8%) took place during November, and the least (6.0%) in February.
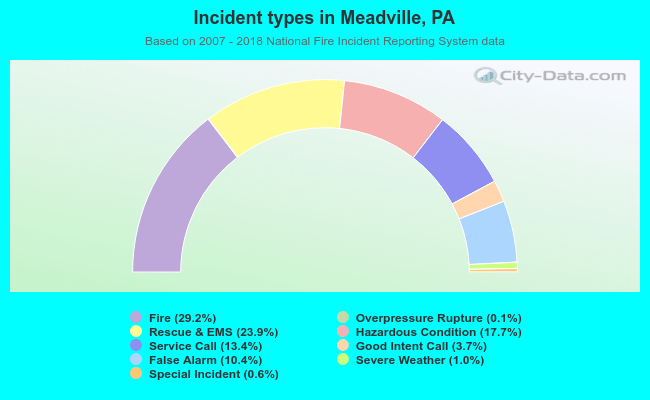 Out of all 4,704 cases reported during the years 2007 - 2018, the most belonged to the categories: Fire (29.2%), Rescue & EMS (23.9%), and Hazardous Condition (17.7%).
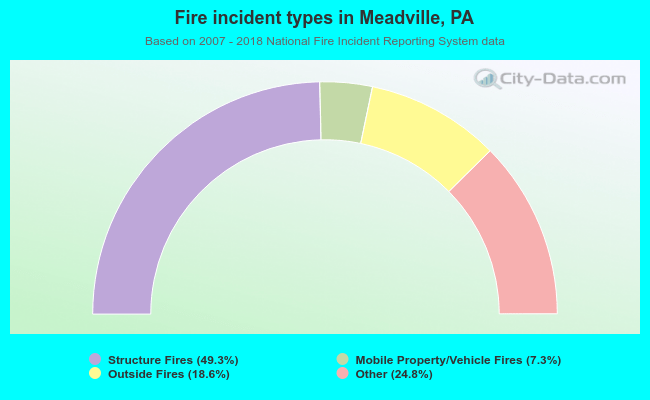 When looking into fire subcategories, the most reports belonged to: Structure Fires (49.3%), and Other (24.8%).