Medora: Fire Incidents, Indiana (IN)
Where are fire incidents reported in Medora, IN
Something went wrong! Please refresh the page.
|
| |||||||||||||||||||||||||||||||||||||||||||||||||||||||||||||||||||||||||||||||||||||||||||||||||||||||||||||
| Other | 12 | |||||||||||||||||||||||||||||||||||||||||||||||||||||||||||||||||||||||||||||||||||||||||||||||||||||||||||||
2004 - 2018 National Fire Incident Reporting System (NFIRS) incidents
- Incident types reported to NFIRS in Medora, IN
- 17260.8%Fire
- 7727.2%Rescue & EMS
- 134.6%Hazardous Condition
- 113.9%Good Intent Call
- 51.8%Severe Weather
- 31.1%Special Incident
- 10.4%Service Call
- 10.4%False Alarm
- Fire incident types reported to NFIRS in Medora, IN
- 8448.8%Structure Fires
- 6135.5%Outside Fires
- 1810.5%Mobile Property/Vehicle Fires
- 95.2%Other
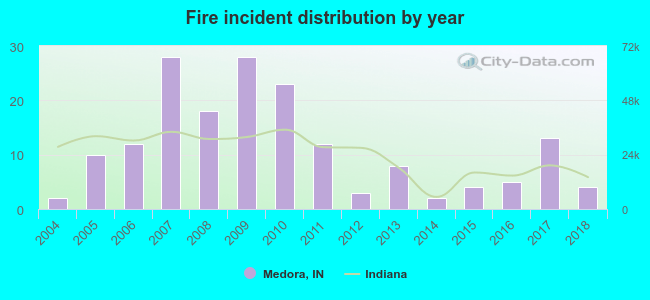 Based on the data from the years 2004 - 2018 the average number of fire incidents per year is 11. The highest number of reported fires - 28 took place in 2007, and the least - 2 in 2004. The data has a growing trend.
 37.2% incidents where reported in the morning and 62.8% in the evening. The most fires (22.1%) took place on Sunday, and the least (8.7%) on Thursday.
 According to the 172 fires from years 2004 - 2018 most fires (18.0%) took place during March, and the least (4.7%) in June.
 Out of all 283 cases reported during the years 2004 - 2018, the most belonged to the categories: Fire (60.8%), Overpressure Rupture (27.2%), and Rescue & EMS (4.6%).
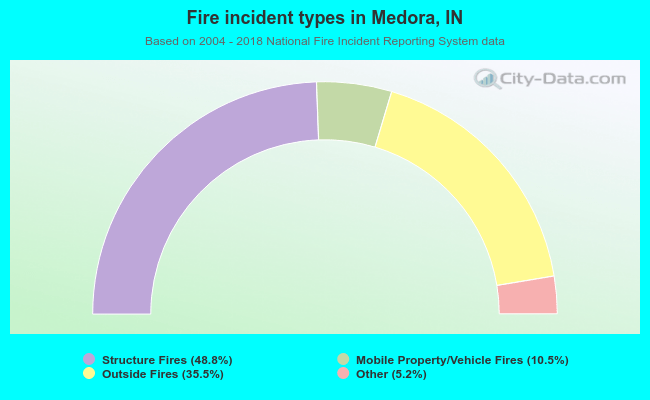 When looking into fire subcategories, the most incidents belonged to: Structure Fires (48.8%), and Outside Fires (35.5%).