Merchantville: Fire Incidents, New Jersey (NJ)
Where are fire incidents reported in Merchantville, NJ
Something went wrong! Please refresh the page.
|
| |||||||||||||||||||||||||||||||||||||||||||||||||||||||||||||||||||||||||||||||||||||||||||||||||||||||||||||
2005 - 2017 National Fire Incident Reporting System (NFIRS) incidents
- Incident types reported to NFIRS in Merchantville, NJ
- 39237.8%Hazardous Condition
- 30429.3%Fire
- 11511.1%False Alarm
- 868.3%Service Call
- 827.9%Good Intent Call
- 393.8%Rescue & EMS
- 161.5%Severe Weather
- Fire incident types reported to NFIRS in Merchantville, NJ
- 24279.6%Structure Fires
- 4615.1%Outside Fires
- 154.9%Mobile Property/Vehicle Fires
- 10.3%Other
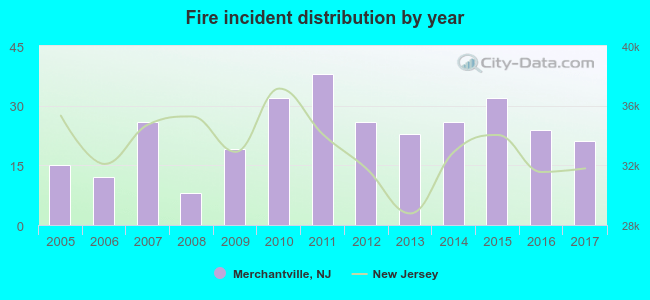 Based on the data from the years 2005 - 2017 the average number of fires per year is 23. The highest number of fires - 38 took place in 2011, and the least - 8 in 2008. The data has a growing trend.
 26.6% incidents where reported in the morning and 73.4% in the evening. The most fires (19.4%) took place on Sunday, and the least (9.2%) on Saturday.
 Based on the 304 fire incidents from years 2005 - 2017 most fires (15.8%) took place during May, and the least (3.9%) in September.
 Out of all 1,036 cases reported during the years 2005 - 2017, the most belonged to the categories: Hazardous Condition (37.8%), Fire (29.3%), and False Alarm (11.1%).
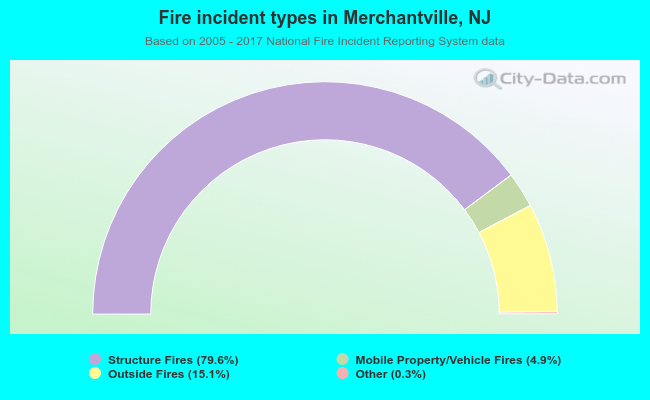 When looking into fire subcategories, the most incidents belonged to: Structure Fires (79.6%), and Outside Fires (15.1%).