Miami Springs: Fire Incidents, Florida (FL)
Where are fire incidents reported in Miami Springs, FL
Something went wrong! Please refresh the page.
|
| |||||||||||||||||||||||||||||||||||||||||||||||||||||||||||||||||||||||||||||||||||||||||||||||||||||||||||||
2008 - 2018 National Fire Incident Reporting System (NFIRS) incidents
- Incident types reported to NFIRS in Miami Springs, FL
- 5,88377.5%Rescue & EMS
- 5357.0%False Alarm
- 3384.5%Good Intent Call
- 3344.4%Service Call
- 2843.7%Hazardous Condition
- 2102.8%Fire
- Fire incident types reported to NFIRS in Miami Springs, FL
- 7736.7%Structure Fires
- 7636.2%Outside Fires
- 4923.3%Mobile Property/Vehicle Fires
- 83.8%Other
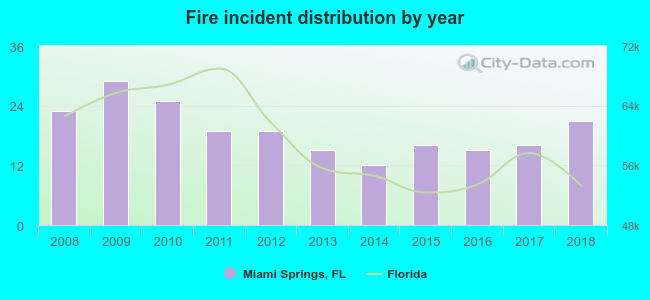 According to the data from the years 2008 - 2018 the average number of fires per year is 19. The highest number of fire incidents - 29 took place in 2009, and the least - 12 in 2014. The data has a decreasing trend.
The average number of yearly fire incidents per 10k residents in Miami Springs, FL compared to nearest cities:
(Note: Based on data for the last 3 years, including only cities with population 5,000 and above)
| Miami Springs: | 12.0 |
| Hialeah: | 7.0 |
| Doral: | 11.9 |
| West Miami: | 11.6 |
| Miami: | 21.7 |
| Hialeah Gardens: | 16.4 |
| Sweetwater: | 7.6 |
| Coral Gables: | 13.7 |
| Miami Lakes: | 11.2 |
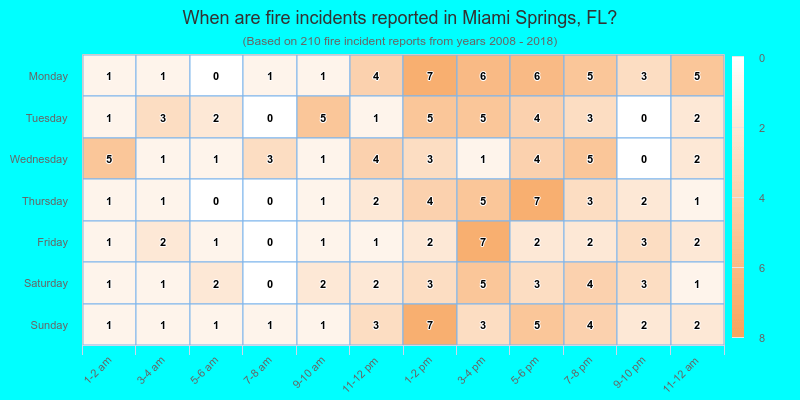
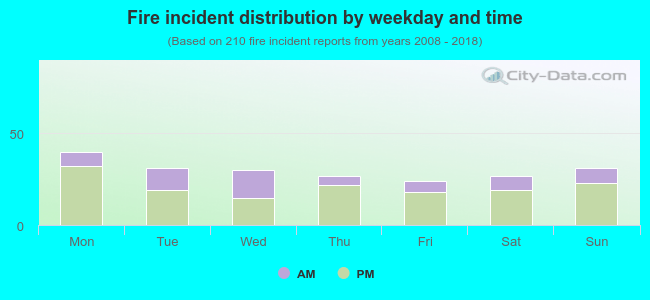 29.5% incidents where reported in the morning and 70.5% in the evening. The most fires (19.0%) took place on Monday, and the least (11.4%) on Friday.
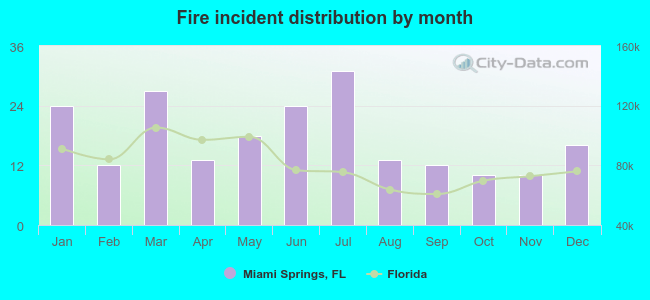 According to the 210 fire incident reports from years 2008 - 2018 most fires (14.8%) took place during July, and the least (4.8%) in October.
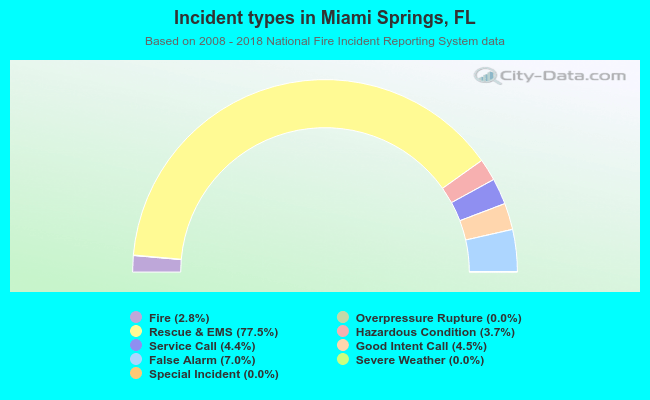 Out of all 7,590 cases reported during the years 2008 - 2018, the most belonged to the categories: Rescue & EMS (77.5%), False Alarm (7.0%), and Good Intent Call (4.5%).
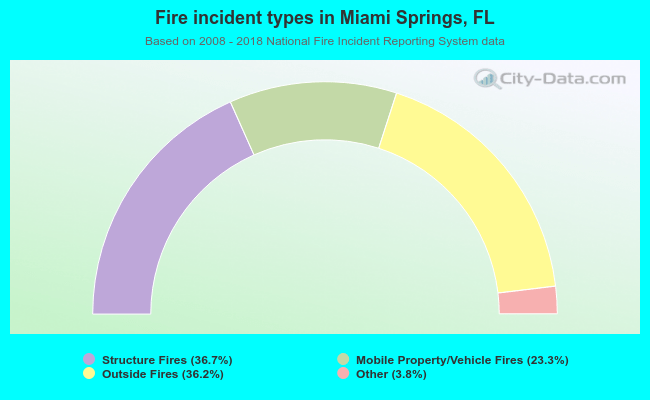 When looking into fire subcategories, the most reports belonged to: Structure Fires (36.7%), and Outside Fires (36.2%).