| Fire incidents reported |
|---|
| Sreet name | Count |
|---|
| JOHN MOSBY HWY | 32 | | ST LOUIS RD | 28 | | WASHINGTON ST | 22 | | OLD MEADOW LN | 18 | | OLD GOOSE CREEK RD | 16 | | ZULLA RD | 16 | | JOHN S MOSBY HWY | 14 | | MILLVILLE RD | 14 | | FEDERAL ST | 12 | | SAM FRED RD | 12 | | JOHN MOSBY HIGHWAY | 10 | | LANDMARK SCHOOL RD | 10 | | SNAKE HILL RD | 10 | | FOUR CHIMNEYS LN | 8 | | JOHN MOSBY HWY | 8 | | KOREA LN | 8 | | WINDY HILL RD | 8 | | COBB HOUSE RD | 6 | | FOXHOUND LN | 6 | | HIBBS BRIDGE RD | 6 | | JOHN MOSBY HWY | 6 | | MOUNTVILLE RD | 6 | | TRAPPE RD | 6 | | UNISON RD | 6 | | 10 FEDERAL ST. | 4 |
| | | Fire incidents reported |
|---|
| Sreet name | Count |
|---|
| 2001 ZULLA RD. RD | 4 | | 300 WINDY HILL ROAD | 4 | | 35395 TRAINING CENTER LN | 4 | | BERRYMAN LN | 4 | | CHINN LN | 4 | | CHRISTINA LN | 4 | | FEDERAL STREET | 4 | | LEITH LN | 4 | | LIME KLIN RD | 4 | | MADISON ST | 4 | | PARSONS RD | 4 | | SNICKERSVILLE TPKE | 4 | | SULLIVANS MILL RD | 4 | | TRAINING CENTER LN | 4 | | TRAPPE RD | 4 | | 1 STONEWALL AVE | 2 | | 10 PENDLETON ST | 2 | | 10 PENDLETON STREET | 2 | | 1000 W. WASHINGTON ST | 2 | | 101 FEDERAL ST WEST | 2 | | 107 WINDY HILL DR | 2 | | 107 WINDY HILL ROAD | 2 | | 11 FEDERAL ST. | 2 | | 110 WASHINGTON ST | 2 | | 110W FEDERAL ST | 2 |
|
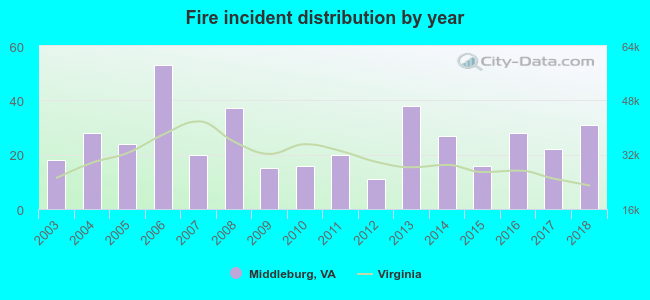 Based on the data from the years 2003 - 2018 the average number of fire incidents per year is 25. The highest number of fires - 53 took place in 2006, and the least - 11 in 2012. The data has a growing trend.
 26.4% incidents where reported in the morning and 73.6% in the evening. The most fires (20.2%) took place on Friday, and the least (11.4%) on Wednesday.
 According to the 405 reports from years 2003 - 2018 most fires (13.1%) took place during January, and the least (4.9%) in August.
 Out of all 2,190 cases reported during the years 2003 - 2018, the most belonged to the categories: Rescue & EMS (30.7%), Fire (18.5%), and Good Intent Call (17.8%).
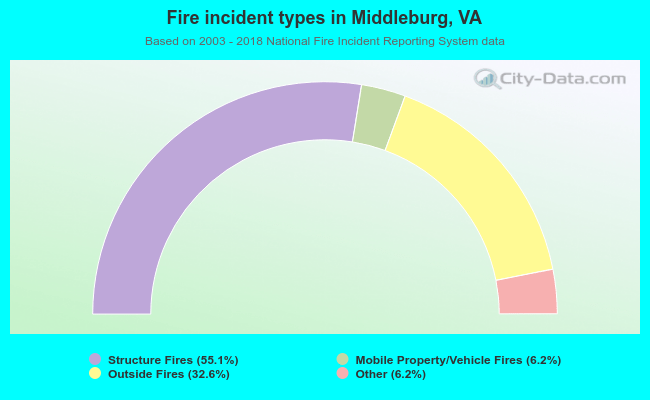 When looking into fire subcategories, the most reports belonged to: Structure Fires (55.1%), and Outside Fires (32.6%).