Middleton: Fire Incidents, Tennessee (TN)
Where are fire incidents reported in Middleton, TN
Something went wrong! Please refresh the page.
|
| |||||||||||||||||||||||||||||||||||||||||||||||||||||||||||||||||||||||||||||||||||||||||||||||||||||||||||||
2006 - 2018 National Fire Incident Reporting System (NFIRS) incidents
- Incident types reported to NFIRS in Middleton, TN
- 26467.9%Fire
- 5012.9%Rescue & EMS
- 348.7%Good Intent Call
- 256.4%Hazardous Condition
- 143.6%False Alarm
- 20.5%Service Call
- Fire incident types reported to NFIRS in Middleton, TN
- 13149.6%Outside Fires
- 8532.2%Structure Fires
- 4316.3%Mobile Property/Vehicle Fires
- 51.9%Other
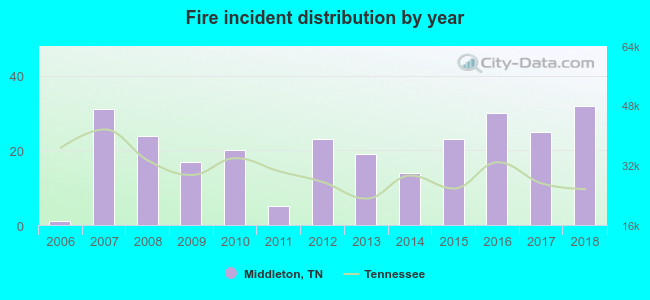 According to the data from the years 2006 - 2018 the average number of fires per year is 20. The highest number of fires - 32 took place in 2018, and the least - 1 in 2006. The data has a growing trend.
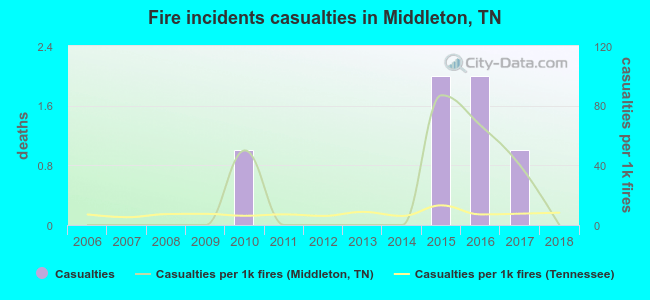 According to the reports from the years 2006 - 2018 the average number of fire-related yearly casualties is 0. The highest number of casualties - 2 took place in 2015, and the lowest - 0 in 2006. The data has a constant trend.
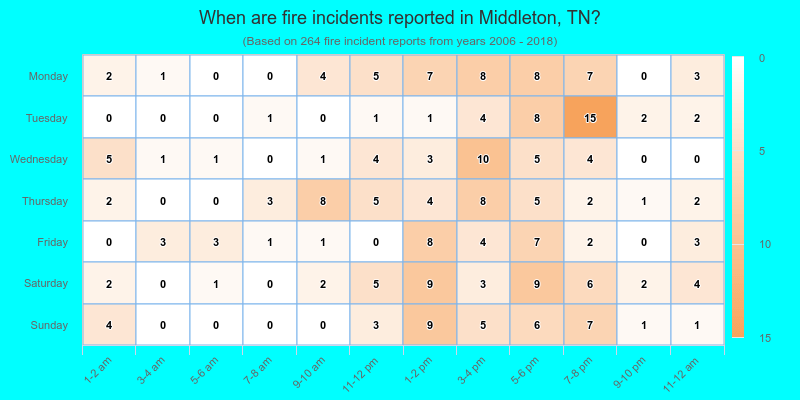
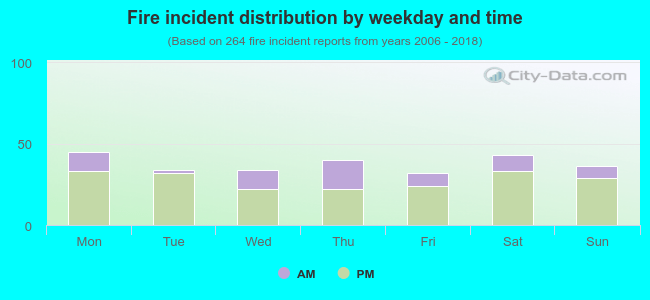 26.1% incidents where reported in the morning and 73.9% in the evening. The most fires (17.0%) took place on Monday, and the least (12.1%) on Friday.
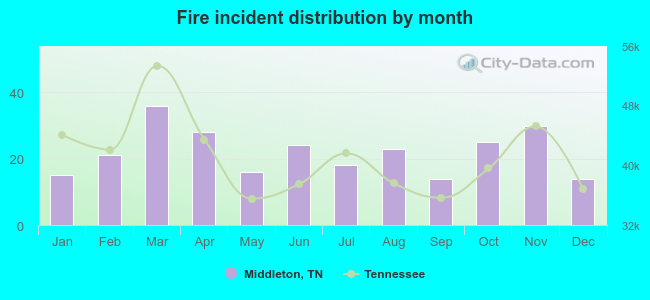 Based on the 264 fire incidents from years 2006 - 2018 most fires (13.6%) took place during March, and the least (5.3%) in September.
 Out of all 389 cases reported during the years 2006 - 2018, the most belonged to the categories: Fire (67.9%), Overpressure Rupture (12.9%), and Service Call (8.7%).
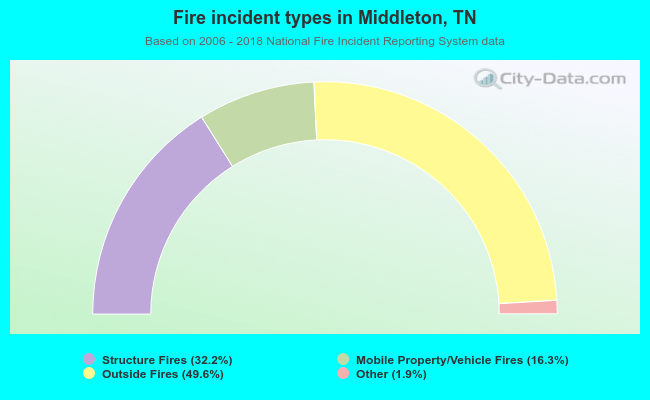 When looking into fire subcategories, the most incidents belonged to: Outside Fires (49.6%), and Structure Fires (32.2%).