| Fire incidents reported |
|---|
| Sreet name | Count |
|---|
| HWY 29 | 54 | | HOT SPRINGS RD | 42 | | SOCRATES MINE RD | 42 | | HWY 29 HWY | 38 | | VAN DORN RESERVOIR RD | 34 | | ROSE ANDERSON RD | 32 | | ANDERSON SPRINGS RD | 30 | | BUTTS CANYON RD | 26 | | JERUSALEM GRADE RD | 22 | | HWY 175 | 20 | | ALDER LN | 14 | | WESTERN MINE RD | 14 | | 29 HWY | 12 | | BIG CANYON RD | 12 | | CALISTOGA ST | 12 | | HIGHWAY 29 HWY | 12 | | DRY CREEK CUTOFF | 8 | | RANCHERIA RD | 8 | | SANTA CLARA RD | 8 | | SPRUCE GROVE RD | 8 | | BARNES ST | 6 | | HWY29 | 6 | | MIRABEL RD | 6 | | SHADY GROVE RD | 6 | | ANDERSON SPRINGS RDS | 4 |
| | | Fire incidents reported |
|---|
| Sreet name | Count |
|---|
| ARMSTRONG ST | 4 | | BRADFORD | 4 | | BRADFORD RD | 4 | | COYOTE VALLEY RD | 4 | | GRANGE RD | 4 | | HARBIN SPRINGS RD | 4 | | HARTMANN RD | 4 | | HOT SPRINGS RDS | 4 | | KNOWLES LN | 4 | | NAPA | 4 | | ROBERTS RD | 4 | | ROSE ANDERSON RDS | 4 | | SAINT HELENA CREEK RD | 4 | | SANTA BARBARA | 4 | | SANTA ROSA | 4 | | STEWART ST | 4 | | WARDLAW ST | 4 | | YOUNG ST | 4 | | 15700 BLK KNOWLES LN | 2 | | 175 HWY | 2 | | 20800 SAN DIEGO AVE | 2 | | 21047 JEFFERSON CT. ST | 2 | | 21600 HWY | 2 | | BAR X RANCH LN | 2 | | |
|
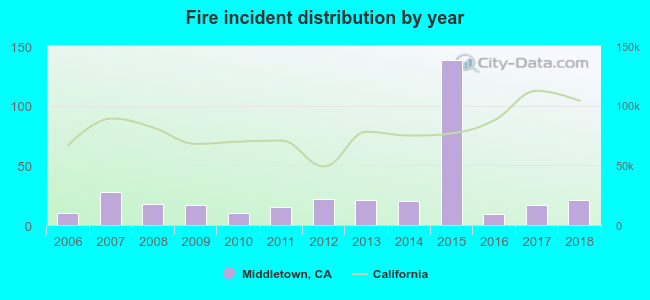 According to the data from the years 2006 - 2018 the average number of fire incidents per year is 27. The highest number of reported fires - 138 took place in 2015, and the least - 9 in 2016. The data has a growing trend.
 23.9% incidents where reported in the morning and 76.1% in the evening. The most fires (43.2%) took place on Saturday, and the least (6.6%) on Thursday.
 According to the 347 fires from years 2006 - 2018 most fires (40.6%) took place during September, and the least (2.6%) in February.
 Out of all 2,219 cases reported during the years 2006 - 2018, the most belonged to the categories: Overpressure Rupture (55.4%), Fire (15.6%), and Hazardous Condition (9.4%).
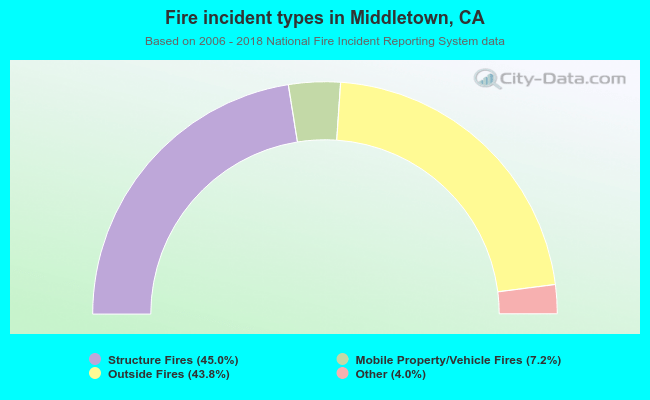 When looking into fire subcategories, the most incidents belonged to: Structure Fires (45.0%), and Outside Fires (43.8%).