Midwest City: Fire Incidents, Oklahoma (OK)
Where are fire incidents reported in Midwest City, OK
Something went wrong! Please refresh the page.
| Fire incidents reported | |
|---|---|
| Sreet name | Count |
| RENO AV | 338 |
| MIDWEST BL | 296 |
| AIR DEPOT BL | 272 |
| 29 ST | 240 |
| 15 ST | 188 |
| DOUGLAS BL | 168 |
| 10 ST | 154 |
| POST RD | 124 |
| 23 ST | 120 |
| RENO | 112 |
| GLENHAVEN DR | 94 |
| SOONER RD | 76 |
| SHADYWOOD DR | 70 |
| SILVERWOOD DR | 70 |
| MIDWEST BLVD | 68 |
| AIR DEPOT BLVD | 66 |
| KEY BL | 58 |
| TINKER DIAGONAL | 58 |
| 29TH | 56 |
| SPENCER RD | 56 |
| OAKGROVE ST | 52 |
| SANDRA DR | 52 |
| DOUGLAS BLVD | 48 |
| 15TH | 44 |
| 23RD | 44 |
| PARKLAWN DR | 44 |
| TROSPER DR | 44 |
| WESTMINSTER RD | 44 |
| SHADYBROOK DR | 40 |
| BELLA VISTA | 38 |
| Other | 726 |
2002 - 2018 National Fire Incident Reporting System (NFIRS) incidents
- Incident types reported to NFIRS in Midwest City, OK
- 25,72063.4%Rescue & EMS
- 4,14510.2%Hazardous Condition
- 3,8609.5%Fire
- 2,8217.0%Service Call
- 2,1165.2%Good Intent Call
- 1,7594.3%False Alarm
- 810.2%Overpressure Rupture
- 450.1%Special Incident
- Fire incident types reported to NFIRS in Midwest City, OK
- 1,76845.8%Outside Fires
- 1,25432.5%Structure Fires
- 60315.6%Mobile Property/Vehicle Fires
- 2356.1%Other
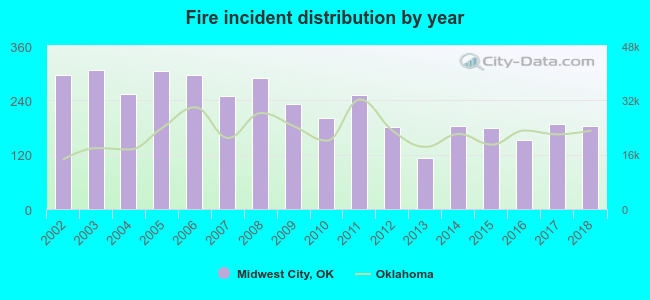 According to the data from the years 2002 - 2018 the average number of fire incidents per year is 227. The highest number of reported fire incidents - 307 took place in 2003, and the least - 112 in 2013. The data has a dropping trend.
The average number of yearly fire incidents per 10k residents in Midwest City, OK compared to nearest cities:
(Note: Based on data for the last 3 years, including only cities with population 5,000 and above)
| Midwest City: | 30.6 |
| Del City: | 42.6 |
| Choctaw: | 100.3 |
| Oklahoma City: | 37.3 |
| Moore: | 24.7 |
| Harrah: | 147.3 |
| The Village: | 24.7 |
| Warr Acres: | 38.4 |
| Edmond: | 49.5 |
 The median response time based on all reported fire incidents is 5 minutes. This is lower compared to the Oklahoma median value.
The median response time in Midwest City, OK compared to nearest cities:
(Note: Based on data for all years, including only cities with at least 500 fire incidents)
| Midwest City: | 5 minutes |
| Spencer: | 4 minutes |
| Del City: | 3 minutes |
| Choctaw: | 6 minutes |
| Oklahoma City: | 5 minutes |
| Jones: | 8 minutes |
| Moore: | 4 minutes |
| Harrah: | 7 minutes |
| The Village: | 3 minutes |
 Based on the data from the years 2002 - 2018 the average number of fire-related yearly deaths is 1. The highest number of reported deaths - 3 took place in 2007, and the lowest - 0 in 2006. The data has a decreasing trend.
The average number of fatalities per 1,000 fire incidents is 5. This indicator was the highest - 16 in 2012, and the lowest 0 in 2006. The trend for deaths per 1,000 fires is decreasing. Compared to the state value the number of fatalities per 1,000 incidents is much higher.
Based on the data from the years 2002 - 2018 the average number of fire-related yearly deaths is 1. The highest number of reported deaths - 3 took place in 2007, and the lowest - 0 in 2006. The data has a decreasing trend.
The average number of fatalities per 1,000 fire incidents is 5. This indicator was the highest - 16 in 2012, and the lowest 0 in 2006. The trend for deaths per 1,000 fires is decreasing. Compared to the state value the number of fatalities per 1,000 incidents is much higher.
 According to the reports from the years 2002 - 2018 the average number of fire-related casualties per year is 4. The highest number of casualties - 16 took place in 2003, and the lowest - 0 in 2012. The data has a decreasing trend.
The average number of casualties per 1,000 fires is 17. This indicator was the highest - 52 in 2003, and the lowest 0 in 2012. The trend for injuries per 1,000 fire incidents is declining. Compared to the Oklahoma value the number of injuries per 1,000 fires is much higher.
According to the reports from the years 2002 - 2018 the average number of fire-related casualties per year is 4. The highest number of casualties - 16 took place in 2003, and the lowest - 0 in 2012. The data has a decreasing trend.
The average number of casualties per 1,000 fires is 17. This indicator was the highest - 52 in 2003, and the lowest 0 in 2012. The trend for injuries per 1,000 fire incidents is declining. Compared to the Oklahoma value the number of injuries per 1,000 fires is much higher.Casualties per 1,000 incidents in Midwest City, OK compared to nearest cities:
(Note: Based on data for all years, including only cities with at least 500 fire incidents)
| Midwest City: | 19.4 |
| Spencer: | 0.8 |
| Del City: | 18.8 |
| Choctaw: | 2.6 |
| Oklahoma City: | 10.7 |
| Jones: | 0.0 |
| Moore: | 22.1 |
| Harrah: | 0.0 |
| The Village: | 3.4 |
 28.2% incidents where reported in the morning and 71.8% in the evening. The most fires (15.5%) took place on Saturday, and the least (13.4%) on Friday.
 Based on the 3,860 fires from years 2002 - 2018 most fires (10.4%) took place during April, and the least (7.1%) in June.
 Out of all 40,571 cases reported during the years 2002 - 2018, the most belonged to the categories: Rescue & EMS (63.4%), Hazardous Condition (10.2%), and Fire (9.5%).
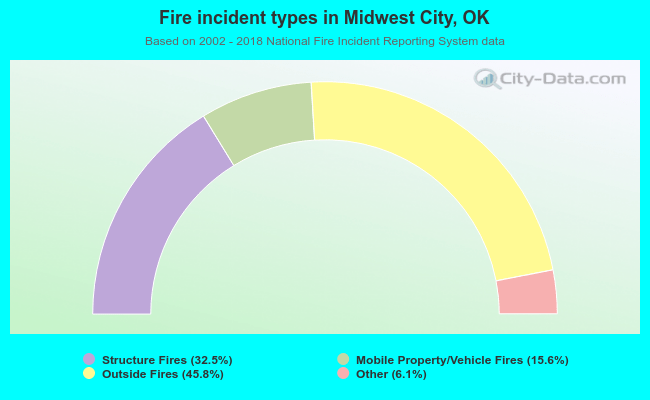 When looking into fire subcategories, the most reports belonged to: Outside Fires (45.8%), and Structure Fires (32.5%).