Mifflinburg: Fire Incidents, Pennsylvania (PA)
Where are fire incidents reported in Mifflinburg, PA
Something went wrong! Please refresh the page.
|
| |||||||||||||||||||||||||||||||||||||||||||||||||||||||||||||||||||||||||||||||||||||||||||||||||||||||||||||
2007 - 2018 National Fire Incident Reporting System (NFIRS) incidents
- Incident types reported to NFIRS in Mifflinburg, PA
- 17343.7%Fire
- 6516.4%Hazardous Condition
- 6416.2%Rescue & EMS
- 358.8%Good Intent Call
- 348.6%False Alarm
- 225.6%Service Call
- 20.5%Severe Weather
- 10.3%Overpressure Rupture
- Fire incident types reported to NFIRS in Mifflinburg, PA
- 9353.8%Structure Fires
- 4224.3%Outside Fires
- 2313.3%Mobile Property/Vehicle Fires
- 158.7%Other
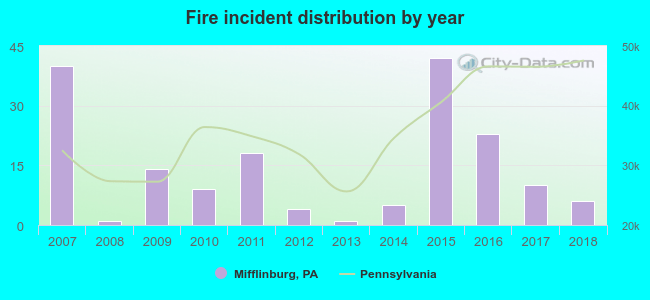 Based on the data from the years 2007 - 2018 the average number of fires per year is 14. The highest number of fire incidents - 42 took place in 2015, and the least - 1 in 2008. The data has a decreasing trend.
 35.8% incidents where reported in the morning and 64.2% in the evening. The most fires (17.9%) took place on Saturday, and the least (9.8%) on Thursday.
 Based on the 173 fire incidents from years 2007 - 2018 most fires (14.5%) took place during March, and the least (4.6%) in July.
 Out of all 396 cases reported during the years 2007 - 2018, the most belonged to the categories: Fire (43.7%), Hazardous Condition (16.4%), and Rescue & EMS (16.2%).
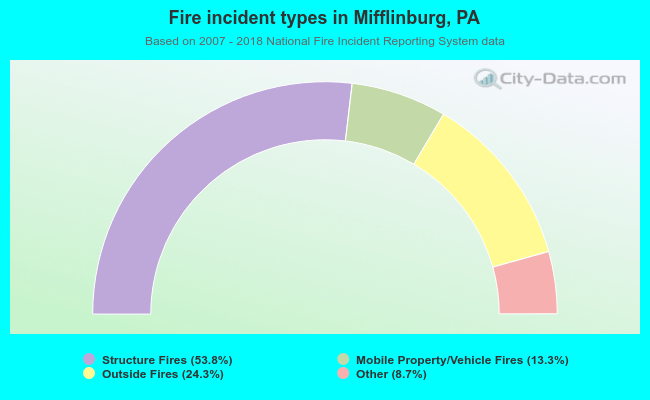 When looking into fire subcategories, the most incidents belonged to: Structure Fires (53.8%), and Outside Fires (24.3%).