Milford: Fire Incidents, Delaware (DE)
Where are fire incidents reported in Milford, DE
Something went wrong! Please refresh the page.
| Fire incidents reported | |
|---|---|
| Sreet name | Count |
| FRONT ST | 138 |
| DUPONT BLVD | 118 |
| WALNUT ST | 96 |
| ALLEN WAY | 84 |
| VALLEY DR | 64 |
| COASTAL HWY | 44 |
| SHAWNEE RD | 42 |
| MARSHALL ST | 34 |
| BAY RD | 30 |
| REHOBOTH BLVD | 30 |
| WILKINS RD | 30 |
| BENSON RD | 28 |
| BIG STONE BEACH RD | 26 |
| BAY AVE | 24 |
| DUPONT HWY | 24 |
| ABBOTTS POND RD | 22 |
| CHURCH ST | 22 |
| NORTH ST | 22 |
| TUB MILL POND RD | 22 |
| WASHINGTON ST | 22 |
| CANTERBURY RD | 20 |
| CLARKE AVE | 18 |
| LINSTONE LN | 18 |
| UNION CHURCH RD | 18 |
| WALNUT STRE | 18 |
| CEDAR BEACH RD | 16 |
| ELKS LODGE RD | 16 |
| VALLEY DRIV | 16 |
| BAY ROAD | 14 |
| CEDAR NECK RD | 14 |
| Other | 313 |
2002 - 2018 National Fire Incident Reporting System (NFIRS) incidents
- Incident types reported to NFIRS in Milford, DE
- 1,40325.9%Fire
- 1,14621.2%Rescue & EMS
- 1,06519.7%Hazardous Condition
- 85115.7%False Alarm
- 4848.9%Good Intent Call
- 4368.1%Service Call
- 150.3%Severe Weather
- 90.2%Special Incident
- Fire incident types reported to NFIRS in Milford, DE
- 70049.9%Structure Fires
- 44531.7%Outside Fires
- 16912.0%Mobile Property/Vehicle Fires
- 896.3%Other
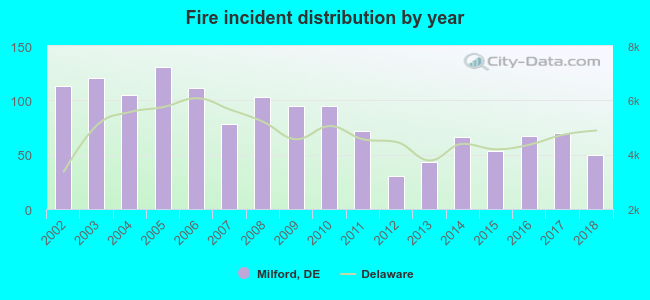 Based on the data from the years 2002 - 2018 the average number of fires per year is 83. The highest number of fires - 131 took place in 2005, and the least - 30 in 2012. The data has a declining trend.
The average number of yearly fire incidents per 10k residents in Milford, DE compared to nearest cities:
(Note: Based on data for the last 3 years, including only cities with population 5,000 and above)
| Milford: | 61.2 |
| Georgetown: | 154.8 |
| Dover: | 47.7 |
| Seaford: | 150.6 |
| Smyrna: | 80.6 |
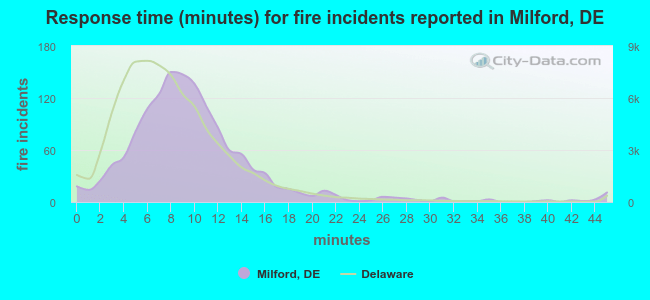 The median response time based on all reported fire incidents is 9 minutes. This is higher than the Delaware median value.
The median response time in Milford, DE compared to nearest cities:
(Note: Based on data for all years, including only cities with at least 500 fire incidents)
| Milford: | 9 minutes |
| Harrington: | 8 minutes |
| Felton: | 9 minutes |
| Magnolia: | 9 minutes |
| Greenwood: | 10 minutes |
| Bridgeville: | 9 minutes |
| Georgetown: | 9 minutes |
| Dover: | 7 minutes |
| Lewes: | 8 minutes |
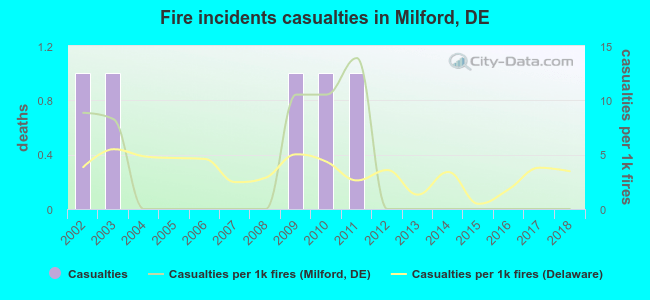 According to the data from the years 2002 - 2018 the average number of fire-related casualties per year is 0. The highest number of casualties - 1 took place in 2002, and the lowest - 0 in 2004. The data has a dropping trend.
The average number of injuries per 1,000 fire incidents is 3. This indicator was the highest - 14 in 2011, and the lowest 0 in 2004. The trend for injuries per 1,000 fire incidents is dropping. Compared to the Delaware value the number of injuries per 1,000 fires is about the same.
According to the data from the years 2002 - 2018 the average number of fire-related casualties per year is 0. The highest number of casualties - 1 took place in 2002, and the lowest - 0 in 2004. The data has a dropping trend.
The average number of injuries per 1,000 fire incidents is 3. This indicator was the highest - 14 in 2011, and the lowest 0 in 2004. The trend for injuries per 1,000 fire incidents is dropping. Compared to the Delaware value the number of injuries per 1,000 fires is about the same.Casualties per 1,000 incidents in Milford, DE compared to nearest cities:
(Note: Based on data for all years, including only cities with at least 500 fire incidents)
| Milford: | 3.6 |
| Harrington: | 0.0 |
| Felton: | 2.5 |
| Magnolia: | 9.4 |
| Greenwood: | 1.6 |
| Bridgeville: | 4.9 |
| Georgetown: | 0.0 |
| Dover: | 7.0 |
| Lewes: | 0.0 |
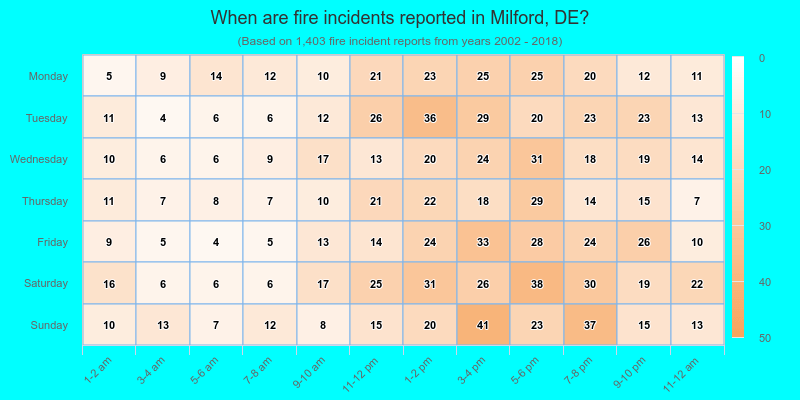
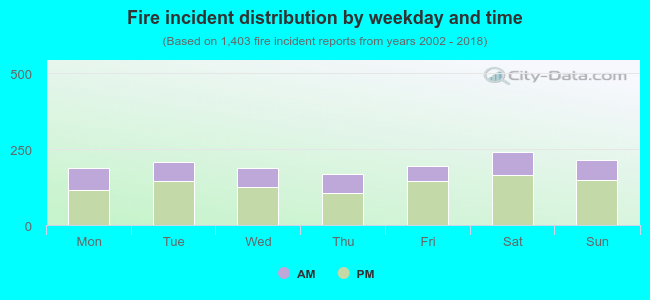 32.2% incidents where reported in the morning and 67.8% in the evening. The most fires (17.2%) took place on Saturday, and the least (12.0%) on Thursday.
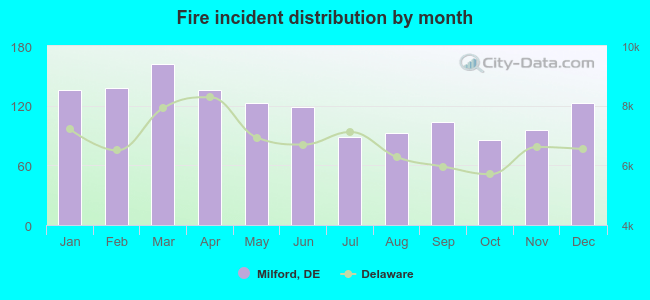 Based on the 1,403 incident reports from years 2002 - 2018 most fires (11.5%) took place during March, and the least (6.1%) in October.
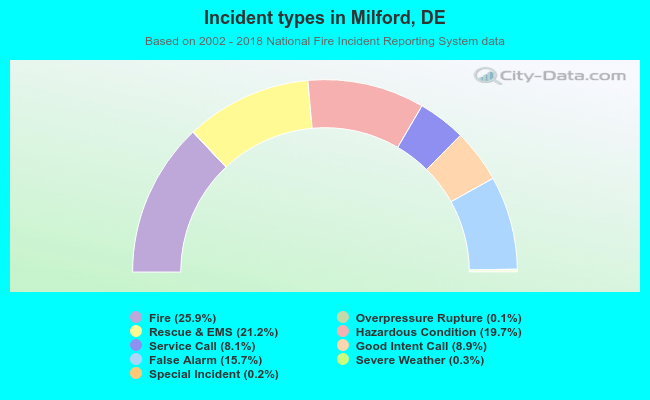 Out of all 5,412 cases reported during the years 2002 - 2018, the most belonged to the categories: Fire (25.9%), Rescue & EMS (21.2%), and Hazardous Condition (19.7%).
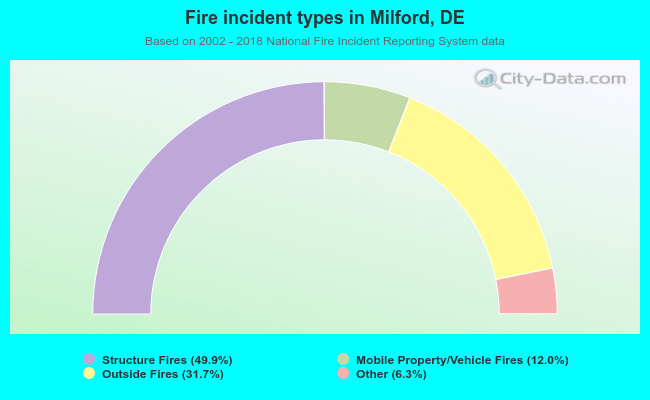 When looking into fire subcategories, the most reports belonged to: Structure Fires (49.9%), and Outside Fires (31.7%).