Mill Hall: Fire Incidents, Pennsylvania (PA)
Where are fire incidents reported in Mill Hall, PA
Something went wrong! Please refresh the page.
|
| |||||||||||||||||||||||||||||||||||||||||||||||||||||||||||||||||||||||||||||||||||||||||||||||||||||||||||||
2003 - 2018 National Fire Incident Reporting System (NFIRS) incidents
- Incident types reported to NFIRS in Mill Hall, PA
- 34736.3%Fire
- 26327.5%Rescue & EMS
- 13013.6%Service Call
- 10511.0%Hazardous Condition
- 757.9%Good Intent Call
- 303.1%False Alarm
- 30.3%Severe Weather
- 20.2%Special Incident
- Fire incident types reported to NFIRS in Mill Hall, PA
- 21562.0%Structure Fires
- 7220.7%Outside Fires
- 4713.5%Mobile Property/Vehicle Fires
- 133.7%Other
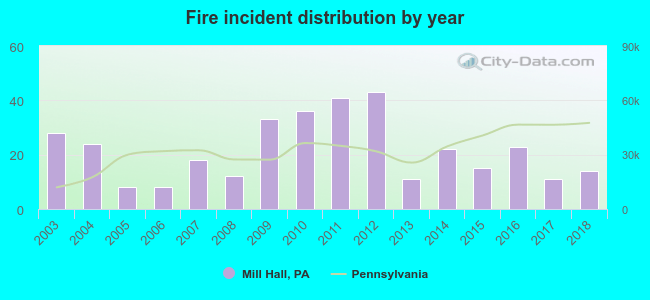 According to the data from the years 2003 - 2018 the average number of fire incidents per year is 22. The highest number of fires - 43 took place in 2012, and the least - 8 in 2005. The data has a dropping trend.
 33.7% incidents where reported in the morning and 66.3% in the evening. The most fires (20.2%) took place on Saturday, and the least (11.0%) on Friday.
 According to the 347 incident reports from years 2003 - 2018 most fires (14.4%) took place during January, and the least (3.2%) in August.
 Out of all 955 cases reported during the years 2003 - 2018, the most belonged to the categories: Fire (36.3%), Overpressure Rupture (27.5%), and Hazardous Condition (13.6%).
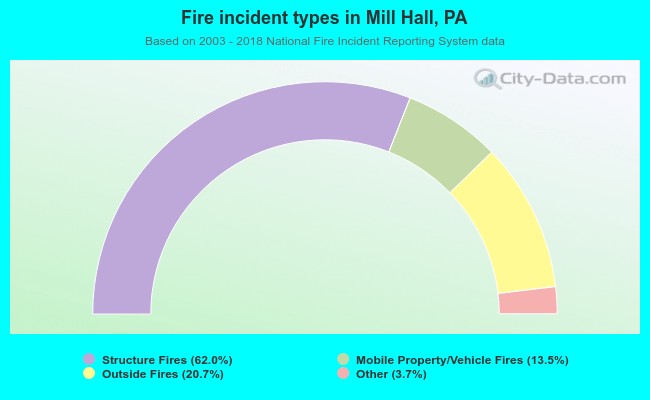 When looking into fire subcategories, the most reports belonged to: Structure Fires (62.0%), and Outside Fires (20.7%).