| Fire incidents reported |
|---|
| Sreet name | Count |
|---|
| BROADWAY AVE | 8 | | 189TH STREET | 6 | | 21304 SD HWY 45 | 6 | | 183RD STREET | 4 | | 21081 BECKET RANCH ROAD | 4 | | 21531 SD HWY 45 | 4 | | 219TH STREET | 4 | | 2ND ST | 4 | | 355TH AVENUE | 4 | | 365TH AVE | 4 | | 366TH AVE | 4 | | 4TH ST | 4 | | 510 EAST 6TH STREET | 4 | | SD HWY 45 | 4 | | 1 WEST AND NORTH OF MILLER SUB | 2 | | 102 SOUTH BROADWAY AVENUE | 2 | | 103 SOUTH BROADWAY AVENU | 2 | | 103 WEST 4TH AVENUE | 2 | | 105 EAST 1ST AVENUE | 2 | | 105 NORTH BROADWAY | 2 | | 108 NORTH BROADWAY AVENUE | 2 | | 10TH AVE | 2 | | 11 AVE | 2 | | 110 EAST THIRD AVENUE | 2 | | 1405 EAST THIRD AVENUE | 2 |
| | | Fire incidents reported |
|---|
| Sreet name | Count |
|---|
| 180 AVE 366 STREET | 2 | | 18250 348TH AV | 2 | | 18446 257TH AVE | 2 | | 18550 357TH AVENUE | 2 | | 186TH ST | 2 | | 188TH STREET AND 356TH | 2 | | 1900 EAST THIRD STREET | 2 | | 191 AND 361 | 2 | | 191 ST | 2 | | 191ST ST | 2 | | 191ST STREET | 2 | | 196 ST AND 357 AVE | 2 | | 19671 355TH AVE | 2 | | 196TH STREET | 2 | | 19750 356TH AVENUE | 2 | | 197TH STREET | 2 | | 197TH STREET 358TH AVE | 2 | | 198TH STREET | 2 | | 1ST AVE | 2 | | 200TH STREET | 2 | | 201 W 14TH ST MILLER SD 5736 | 2 | | 201ST ST | 2 | | 202 STREET 357TH AVE | 2 | | 20301 356TH AVENUE | 2 | | |
|
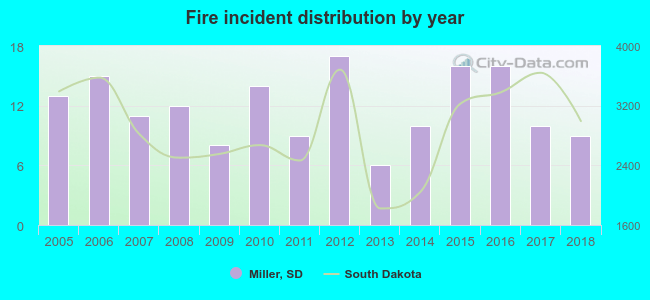 Based on the data from the years 2005 - 2018 the average number of fires per year is 12. The highest number of reported fire incidents - 17 took place in 2012, and the least - 6 in 2013. The data has a dropping trend.
 19.3% incidents where reported in the morning and 80.7% in the evening. The most fires (16.3%) took place on Saturday, and the least (10.8%) on Thursday.
 Based on the 166 fires from years 2005 - 2018 most fires (13.9%) took place during July, and the least (1.2%) in January.
 Out of all 306 cases reported during the years 2005 - 2018, the most belonged to the categories: Fire (54.2%), Rescue & EMS (10.8%), and Good Intent Call (9.2%).
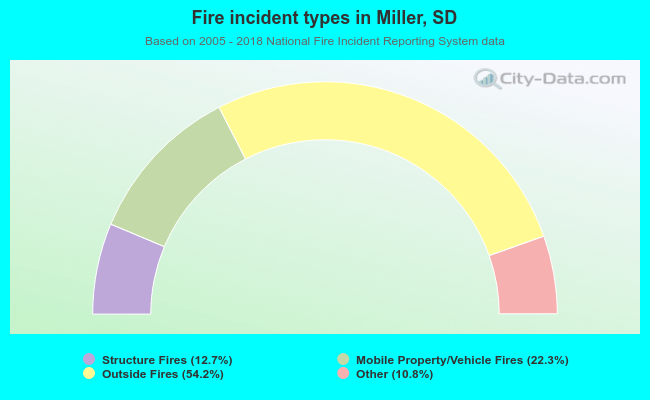 When looking into fire subcategories, the most incidents belonged to: Outside Fires (54.2%), and Mobile Property/Vehicle Fires (22.3%).