| Fire incidents reported |
|---|
| Sreet name | Count |
|---|
| ROUTE 22 | 38 | | BOSTON CORNERS RD | 14 | | ROUTE 83 | 10 | | COLEMAN STATION RD | 8 | | OLD ROUTE 22 | 8 | | ROUTE 44 | 8 | | SHARON ROAD | 8 | | WINCHELL MOUNTAIN RD | 8 | | MAIN ST | 6 | | MAIN STREET | 6 | | ROUTE 199 | 6 | | RT 22 | 6 | | RUDD POND RD | 6 | | SCENIC VIEW | 6 | | 22 | 4 | | CENTURY BLVD | 4 | | COOPER RD | 4 | | HAIGHT RD | 4 | | HIGHLAND ST | 4 | | INDIAN LAKE RD | 4 | | INTERLAKEN RD | 4 | | JACKSON CENTER RD | 4 | | MCGHEE HILL RD | 4 | | MILL RD | 4 | | MILL ROAD | 4 |
| | | Fire incidents reported |
|---|
| Sreet name | Count |
|---|
| N CENTER ST | 4 | | NORTH CENTER STREET | 4 | | NORTH STS | 4 | | RT 44 | 4 | | SAWCHUCK ROAD | 4 | | SHARON RD | 4 | | SHARON STATION ROAD | 4 | | SHEFFIELD HILL RD | 4 | | SILVER MOUNTAIN RD | 4 | | SKUNKS MISERY ROAD | 4 | | 1 RAILROAD PLAZA | 2 | | 108 RT 44 | 2 | | 122 CHARLIE HILL RD RD | 2 | | 1409 BOSTON CORNERS RD | 2 | | 1451 RT 83 | 2 | | 151 LAKE LN | 2 | | 167 SMITHFIELD RD | 2 | | 1691 BOSTON CORNERS RD | 2 | | 22 RT | 2 | | 229 MILLERTON RD | 2 | | 231 MILLERTON RD | 2 | | 26 MAIN ST | 2 | | 262 CC RT7 | 2 | | 3 MILLERTON RD | 2 | | |
|
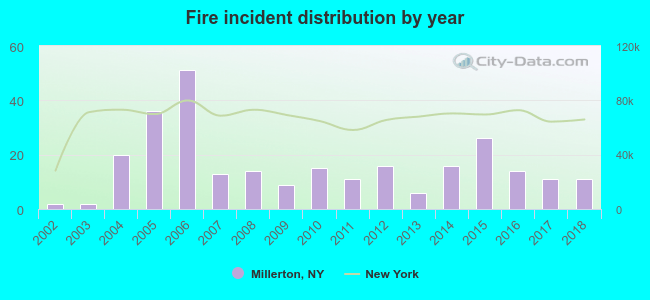 According to the data from the years 2002 - 2018 the average number of fire incidents per year is 16. The highest number of reported fire incidents - 51 took place in 2006, and the least - 2 in 2002. The data has a rising trend.
 28.9% incidents where reported in the morning and 71.1% in the evening. The most fires (16.8%) took place on Saturday, and the least (11.4%) on Friday.
 Based on the 273 fire incidents from years 2002 - 2018 most fires (15.8%) took place during April, and the least (4.4%) in August.
 Out of all 1,791 cases reported during the years 2002 - 2018, the most belonged to the categories: Rescue & EMS (42.7%), Hazardous Condition (17.4%), and Fire (15.2%).
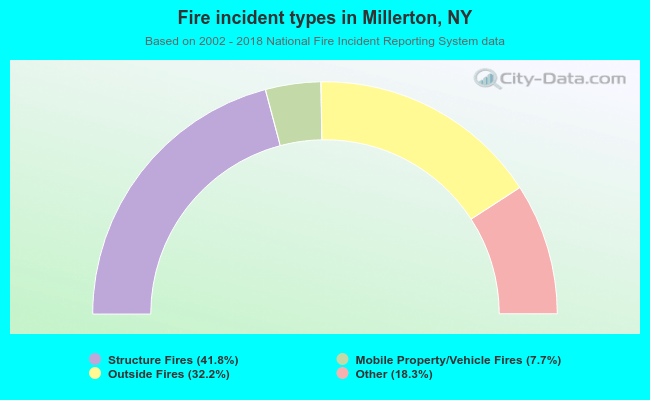 When looking into fire subcategories, the most incidents belonged to: Structure Fires (41.8%), and Outside Fires (32.2%).