Millport: Fire Incidents, New York (NY)
Where are fire incidents reported in Millport, NY
Something went wrong! Please refresh the page.
|
| |||||||||||||||||||||||||||||||||||||||||||||||||||||||||||||||||||||||||||||||||||||||||||||
2002 - 2018 National Fire Incident Reporting System (NFIRS) incidents
- Incident types reported to NFIRS in Millport, NY
- 34548.3%Rescue & EMS
- 13118.3%Fire
- 9112.7%Hazardous Condition
- 446.2%Severe Weather
- 395.5%False Alarm
- 375.2%Service Call
- 273.8%Good Intent Call
- Fire incident types reported to NFIRS in Millport, NY
- 6146.6%Outside Fires
- 4534.4%Structure Fires
- 2216.8%Mobile Property/Vehicle Fires
- 32.3%Other
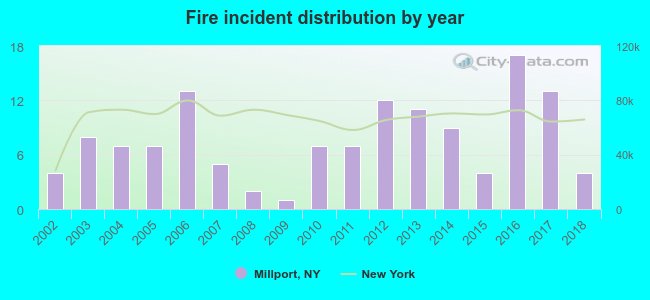 According to the data from the years 2002 - 2018 the average number of fire incidents per year is 8. The highest number of reported fire incidents - 17 took place in 2016, and the least - 1 in 2009. The data has a constant trend.
 22.9% incidents where reported in the morning and 77.1% in the evening. The most fires (17.6%) took place on Thursday, and the least (11.5%) on Wednesday.
 According to the 131 fires from years 2002 - 2018 most fires (19.8%) took place during April, and the least (2.3%) in October.
 Out of all 714 cases reported during the years 2002 - 2018, the most belonged to the categories: Overpressure Rupture (48.3%), Fire (18.3%), and Rescue & EMS (12.7%).
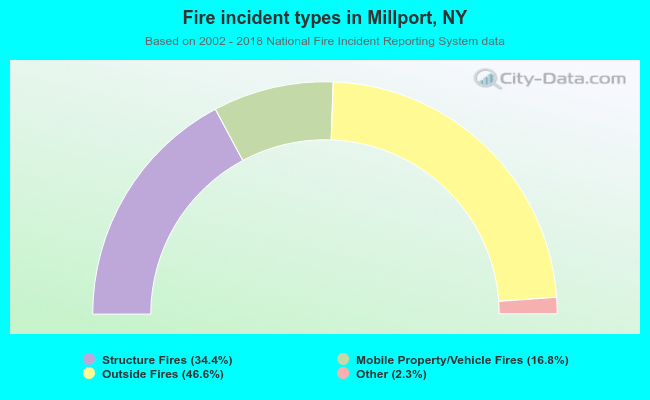 When looking into fire subcategories, the most reports belonged to: Outside Fires (46.6%), and Structure Fires (34.4%).