Minburn: Fire Incidents, Iowa (IA)
Where are fire incidents reported in Minburn, IA
Something went wrong! Please refresh the page.
|
| |||||||||||||||||||||||||||||||||||||||||||||||||||||||||||||||||||||||||||||||||||||||||||||||||||||||||||||
2003 - 2018 National Fire Incident Reporting System (NFIRS) incidents
- Incident types reported to NFIRS in Minburn, IA
- 10263.0%Fire
- 1710.5%Hazardous Condition
- 159.3%Good Intent Call
- 106.2%Service Call
- 95.6%Rescue & EMS
- 42.5%False Alarm
- 42.5%Special Incident
- 10.6%Severe Weather
- Fire incident types reported to NFIRS in Minburn, IA
- 4645.1%Structure Fires
- 4342.2%Outside Fires
- 87.8%Other
- 54.9%Mobile Property/Vehicle Fires
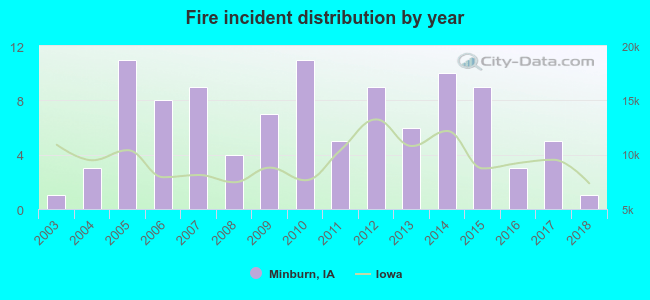 Based on the data from the years 2003 - 2018 the average number of fires per year is 6. The highest number of fire incidents - 11 took place in 2005, and the least - 1 in 2003. The data has a constant trend.
 40.2% incidents where reported in the morning and 59.8% in the evening. The most fires (26.5%) took place on Sunday, and the least (5.9%) on Tuesday.
 Based on the 102 fire incident reports from years 2003 - 2018 most fires (15.7%) took place during March, and the least (2.9%) in August.
 Out of all 162 cases reported during the years 2003 - 2018, the most belonged to the categories: Fire (63.0%), Rescue & EMS (10.5%), and Service Call (9.3%).
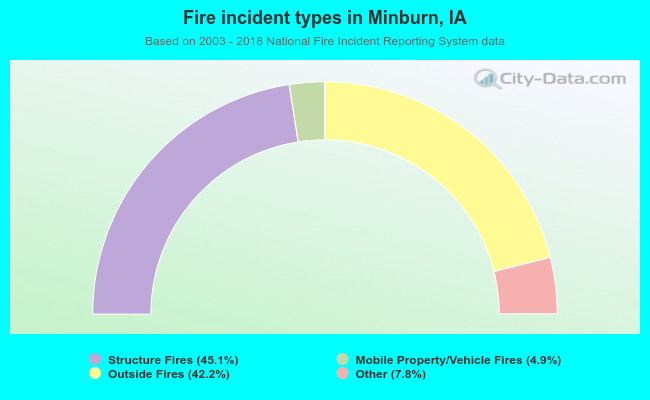 When looking into fire subcategories, the most incidents belonged to: Structure Fires (45.1%), and Outside Fires (42.2%).