Mineral Springs: Fire Incidents, Arkansas (AR)
Where are fire incidents reported in Mineral Springs, AR
Something went wrong! Please refresh the page.
|
| |||||||||||||||||||||||||||||||||||||||||||||||||||||||||||||||||||||||||||||||||||||||||||||||||||||||||||||
2002 - 2018 National Fire Incident Reporting System (NFIRS) incidents
- Incident types reported to NFIRS in Mineral Springs, AR
- 30857.4%Fire
- 19937.1%Rescue & EMS
- 152.8%Good Intent Call
- 40.7%Service Call
- 40.7%Severe Weather
- 30.6%False Alarm
- 20.4%Overpressure Rupture
- 20.4%Hazardous Condition
- Fire incident types reported to NFIRS in Mineral Springs, AR
- 13744.5%Structure Fires
- 12039.0%Outside Fires
- 4013.0%Mobile Property/Vehicle Fires
- 113.6%Other
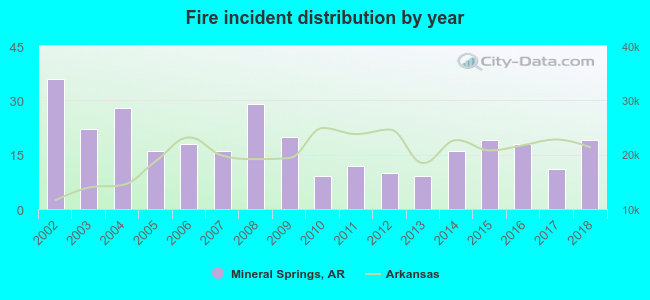 According to the data from the years 2002 - 2018 the average number of fires per year is 18. The highest number of fire incidents - 36 took place in 2002, and the least - 9 in 2010. The data has a decreasing trend.
 31.5% incidents where reported in the morning and 68.5% in the evening. The most fires (17.5%) took place on Wednesday, and the least (12.0%) on Friday.
 According to the 308 reports from years 2002 - 2018 most fires (14.3%) took place during January, and the least (3.9%) in May.
 Out of all 537 cases reported during the years 2002 - 2018, the most belonged to the categories: Fire (57.4%), Rescue & EMS (37.1%), and Good Intent Call (2.8%).
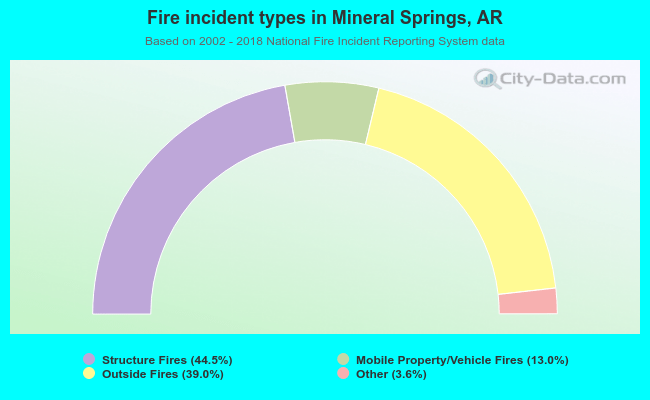 When looking into fire subcategories, the most incidents belonged to: Structure Fires (44.5%), and Outside Fires (39.0%).