Mojave: Fire Incidents, California (CA)
Where are fire incidents reported in Mojave, CA
Something went wrong! Please refresh the page.
|
| |||||||||||||||||||||||||||||||||||||||||||||||||||||||||||||||||||||||||||||||||||||||||||||||||||||||||||||
2005 - 2018 National Fire Incident Reporting System (NFIRS) incidents
- Incident types reported to NFIRS in Mojave, CA
- 2,49753.6%Rescue & EMS
- 96320.7%Good Intent Call
- 49610.6%Fire
- 3988.5%Hazardous Condition
- 1493.2%Service Call
- 1232.6%False Alarm
- 340.7%Special Incident
- Fire incident types reported to NFIRS in Mojave, CA
- 24048.4%Outside Fires
- 14028.2%Structure Fires
- 11022.2%Mobile Property/Vehicle Fires
- 61.2%Other
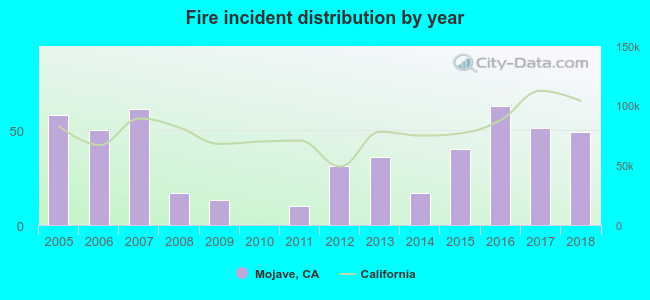 Based on the data from the years 2005 - 2018 the average number of fires per year is 35. The highest number of fires - 63 took place in 2016, and the least - 0 in 2010. The data has a declining trend.
 Based on the data from the years 2005 - 2018 the average number of fire-related casualties per year is 0. The highest number of injuries - 2 took place in 2013, and the lowest - 0 in 2005. The data has a rising trend.
 33.1% incidents where reported in the morning and 66.9% in the evening. The most fires (18.1%) took place on Saturday, and the least (11.7%) on Wednesday.
 According to the 496 fire incident reports from years 2005 - 2018 most fires (13.3%) took place during July, and the least (4.8%) in February.
 Out of all 4,660 cases reported during the years 2005 - 2018, the most belonged to the categories: Overpressure Rupture (53.6%), Service Call (20.7%), and Fire (10.6%).
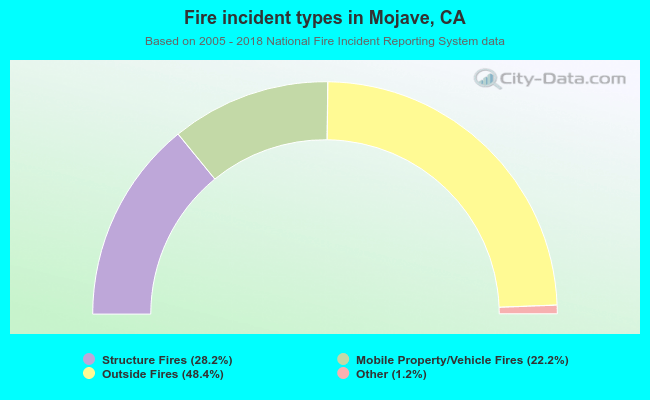 When looking into fire subcategories, the most reports belonged to: Outside Fires (48.4%), and Structure Fires (28.2%).