Moline: Fire Incidents, Kansas (KS)
Where are fire incidents reported in Moline, KS
Something went wrong! Please refresh the page.
|
| |||||||||||||||||||||||||||||||||||||||||||||||||||||||||||||||||||||||||||||||||||||||||||||||||||||||||||||
2005 - 2018 National Fire Incident Reporting System (NFIRS) incidents
- Incident types reported to NFIRS in Moline, KS
- 14985.6%Fire
- 95.2%Rescue & EMS
- 84.6%Good Intent Call
- 63.4%Hazardous Condition
- 21.1%Service Call
- Fire incident types reported to NFIRS in Moline, KS
- 8859.1%Outside Fires
- 4932.9%Structure Fires
- 85.4%Mobile Property/Vehicle Fires
- 42.7%Other
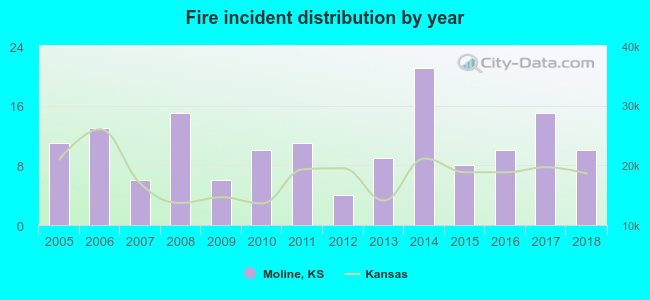 Based on the data from the years 2005 - 2018 the average number of fires per year is 11. The highest number of fire incidents - 21 took place in 2014, and the least - 4 in 2012. The data has a decreasing trend.
 24.2% incidents where reported in the morning and 75.8% in the evening. The most fires (24.8%) took place on Monday, and the least (8.7%) on Tuesday.
 According to the 149 fire incident reports from years 2005 - 2018 most fires (23.5%) took place during April, and the least (2.7%) in June.
 Out of all 174 cases reported during the years 2005 - 2018, the most belonged to the categories: Fire (85.6%), Overpressure Rupture (5.2%), and Service Call (4.6%).
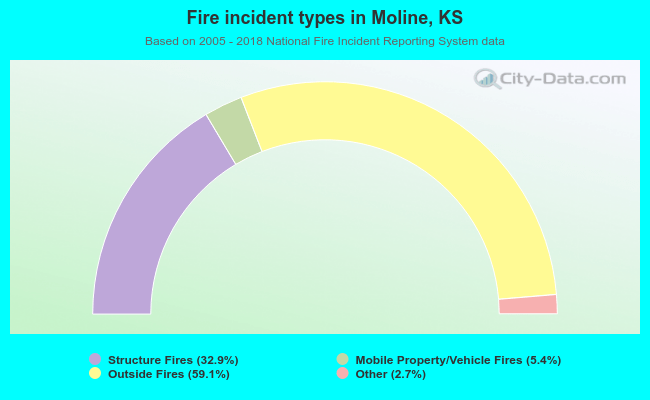 When looking into fire subcategories, the most incidents belonged to: Outside Fires (59.1%), and Structure Fires (32.9%).