Monmouth: Fire Incidents, Illinois (IL)
Where are fire incidents reported in Monmouth, IL
Something went wrong! Please refresh the page.
| Fire incidents reported | |
|---|---|
| Sreet name | Count |
| 6TH ST | 88 |
| MAIN ST | 88 |
| D ST | 62 |
| 11TH ST | 48 |
| BROADWAY | 48 |
| 9TH ST | 44 |
| B ST | 40 |
| 11TH AVE | 34 |
| 1ST ST | 32 |
| 6TH AVE | 28 |
| 5TH AVE | 26 |
| 200TH AVE | 24 |
| A ST | 24 |
| E ST | 24 |
| 2ND AVE | 20 |
| 3RD AVE | 20 |
| 4TH AVE | 20 |
| 10TH ST | 18 |
| 5TH ST | 18 |
| BOSTON AVE | 18 |
| C ST | 18 |
| 2ND ST | 16 |
| 7TH ST | 16 |
| 1ST AVE | 14 |
| 3RD ST | 14 |
| CLINTON AVE | 14 |
| EUCLID AVE | 14 |
| 3RD AVE | 12 |
| 4TH ST | 12 |
| FRANKLIN AVE | 12 |
| Other | 36 |
2004 - 2018 National Fire Incident Reporting System (NFIRS) incidents
- Incident types reported to NFIRS in Monmouth, IL
- 3,29839.5%Rescue & EMS
- 1,91122.9%Hazardous Condition
- 1,19914.4%Service Call
- 90210.8%Fire
- 5336.4%False Alarm
- 4615.5%Good Intent Call
- 230.3%Overpressure Rupture
- 90.1%Special Incident
- Fire incident types reported to NFIRS in Monmouth, IL
- 36140.0%Outside Fires
- 33837.5%Structure Fires
- 13014.4%Mobile Property/Vehicle Fires
- 738.1%Other
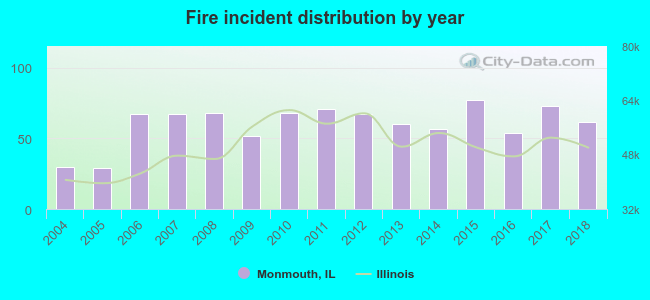 Based on the data from the years 2004 - 2018 the average number of fire incidents per year is 60. The highest number of fires - 77 took place in 2015, and the least - 29 in 2005. The data has a growing trend.
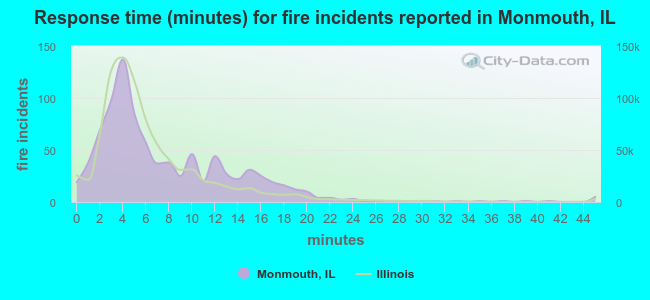 The median response time based on all reported fire incidents is 6 minutes. This is about the same as the Illinois median value.
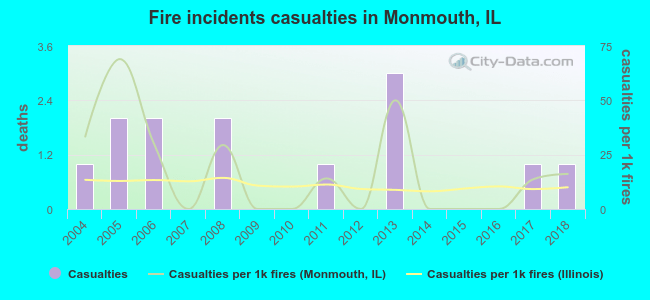 According to the reports from the years 2004 - 2018 the average number of fire-related yearly casualties is 1. The highest number of reported injuries - 3 took place in 2013, and the lowest - 0 in 2007. The data has a constant trend.
The average number of casualties per 1,000 fire incidents is 17. This indicator was the highest - 69 in 2005, and the lowest 0 in 2007. The trend for injuries per 1,000 fire incidents is dropping. Compared to the state value the number of casualties per 1,000 fire incidents is higher.
According to the reports from the years 2004 - 2018 the average number of fire-related yearly casualties is 1. The highest number of reported injuries - 3 took place in 2013, and the lowest - 0 in 2007. The data has a constant trend.
The average number of casualties per 1,000 fire incidents is 17. This indicator was the highest - 69 in 2005, and the lowest 0 in 2007. The trend for injuries per 1,000 fire incidents is dropping. Compared to the state value the number of casualties per 1,000 fire incidents is higher.
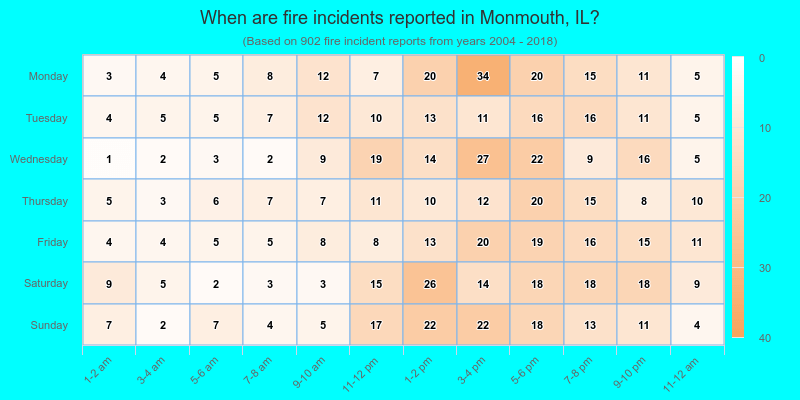
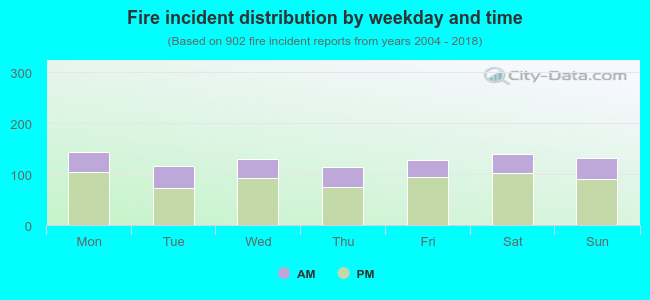 29.9% incidents where reported in the morning and 70.1% in the evening. The most fires (16.0%) took place on Monday, and the least (12.6%) on Thursday.
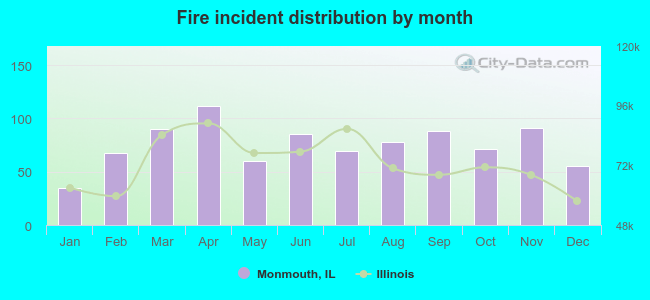 According to the 902 incident reports from years 2004 - 2018 most fires (12.4%) took place during April, and the least (3.9%) in January.
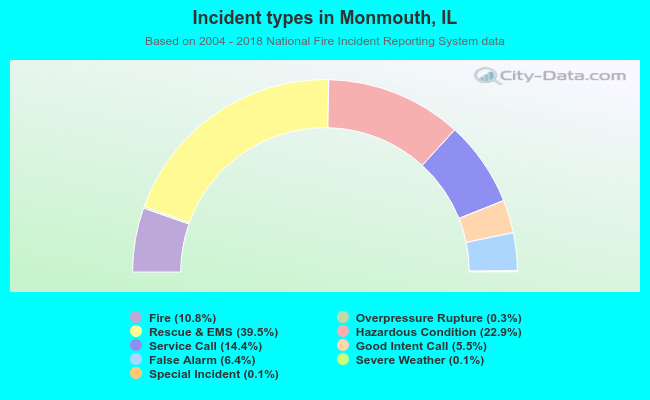 Out of all 8,341 cases reported during the years 2004 - 2018, the most belonged to the categories: Rescue & EMS (39.5%), Hazardous Condition (22.9%), and Service Call (14.4%).
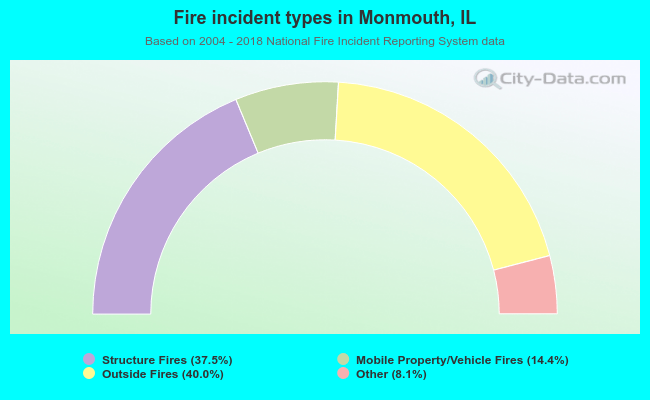 When looking into fire subcategories, the most incidents belonged to: Outside Fires (40.0%), and Structure Fires (37.5%).