Montague: Fire Incidents, Michigan (MI)
Where are fire incidents reported in Montague, MI
Something went wrong! Please refresh the page.
|
| |||||||||||||||||||||||||||||||||||||||||||||||||||||||||||||||||||||||||||||||||||||||||||||||||||||||||||||
2002 - 2018 National Fire Incident Reporting System (NFIRS) incidents
- Incident types reported to NFIRS in Montague, MI
- 1,46550.1%Rescue & EMS
- 43314.8%Fire
- 40113.7%Hazardous Condition
- 29710.2%Service Call
- 2167.4%Good Intent Call
- 1023.5%False Alarm
- 30.1%Overpressure Rupture
- 30.1%Special Incident
- Fire incident types reported to NFIRS in Montague, MI
- 15636.0%Outside Fires
- 14433.3%Structure Fires
- 7216.6%Mobile Property/Vehicle Fires
- 6114.1%Other
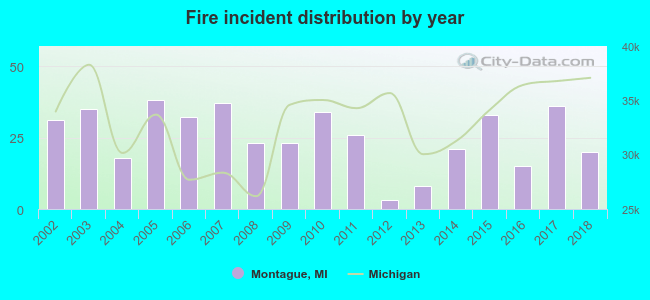 Based on the data from the years 2002 - 2018 the average number of fire incidents per year is 25. The highest number of fire incidents - 38 took place in 2005, and the least - 3 in 2012. The data has a declining trend.
 23.8% incidents where reported in the morning and 76.2% in the evening. The most fires (18.2%) took place on Saturday, and the least (10.4%) on Friday.
 According to the 433 reports from years 2002 - 2018 most fires (17.8%) took place during April, and the least (4.2%) in January.
 Out of all 2,922 cases reported during the years 2002 - 2018, the most belonged to the categories: Rescue & EMS (50.1%), Fire (14.8%), and Hazardous Condition (13.7%).
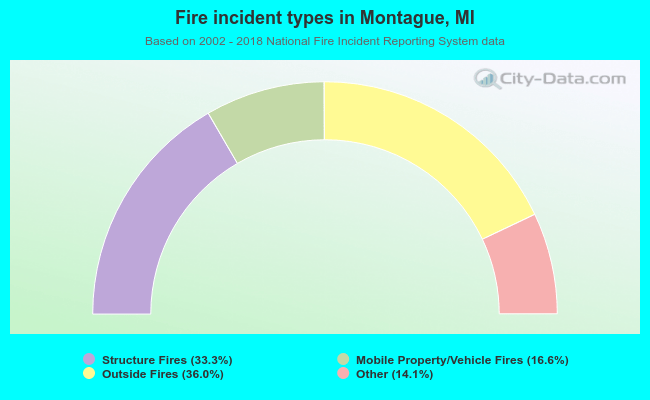 When looking into fire subcategories, the most incidents belonged to: Outside Fires (36.0%), and Structure Fires (33.3%).