| Fire incidents reported |
|---|
| Sreet name | Count |
|---|
| CARMINATI RD | 10 | | FM 1806 | 10 | | BARREL SPRINGS RD RD | 8 | | HWY 59 | 8 | | 1806 | 6 | | FM 455 | 6 | | HWY 59 S | 6 | | PR 350 | 6 | | SH 59 | 6 | | 1806 4 MILES WEST | 4 | | CATHOLIC CEMETARY RD | 4 | | CATHOLIC CEMETARY RD | 4 | | JOHNSON LOOP | 4 | | NOBILE RD | 4 | | QUAIL RIDGE RD | 4 | | ROCK SPRINGS SCHOOL RD | 4 | | 1206 HWY 1806 HWY | 2 | | 1710 S JOHNSON LOOP | 2 | | 1751 BLUFF ST | 2 | | 2 MILES ON 1806 | 2 | | 3004 FM 1806 | 2 | | 301 CLAY STREET | 2 | | 343 PR 409 RD | 2 | | 410 ALAMO RD RD | 2 | | 4121 HIDRETH POOL RD | 2 |
| | | Fire incidents reported |
|---|
| Sreet name | Count |
|---|
| 455 S 1 MILE | 2 | | 455 W @ HILDRETH POOL RD RD | 2 | | 459 PADDOCK RD | 2 | | 552 HILDRETH POOL RD RD | 2 | | 816 ALLEN RD RD | 2 | | ALAMO RD | 2 | | AUREILA SCHOOL RD | 2 | | AURELIA SCHOOL RD RD | 2 | | AUREUILA SCHOOL RD | 2 | | BARREL SPRINGS RD | 2 | | BROWN RD | 2 | | CARMINANTI RD | 2 | | CLAY | 2 | | CLAY / HALL FIRST BAPTIS | 2 | | CLAY ST | 2 | | CLAY STREET | 2 | | DAVIS ST ST | 2 | | DIXIE SCHOOL RD | 2 | | FECHTLER RD | 2 | | FM 1806 & BARRELL SPRINGS RD | 2 | | FM 1806 LGTS | 2 | | FM 1816 | 2 | | FM 455 LGTS | 2 | | FM1806 | 2 | | |
|
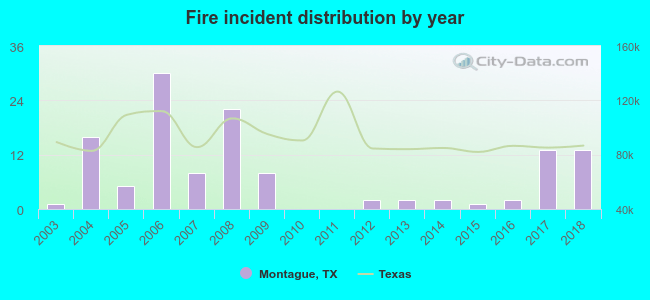 Based on the data from the years 2003 - 2018 the average number of fires per year is 8. The highest number of reported fires - 30 took place in 2006, and the least - 0 in 2010. The data has a growing trend.
 21.6% incidents where reported in the morning and 78.4% in the evening. The most fires (26.4%) took place on Tuesday, and the least (9.6%) on Friday.
 Based on the 125 fire incident reports from years 2003 - 2018 most fires (19.2%) took place during July, and the least (4.0%) in August.
 Out of all 268 cases reported during the years 2003 - 2018, the most belonged to the categories: Fire (46.6%), Overpressure Rupture (38.4%), and Service Call (6.3%).
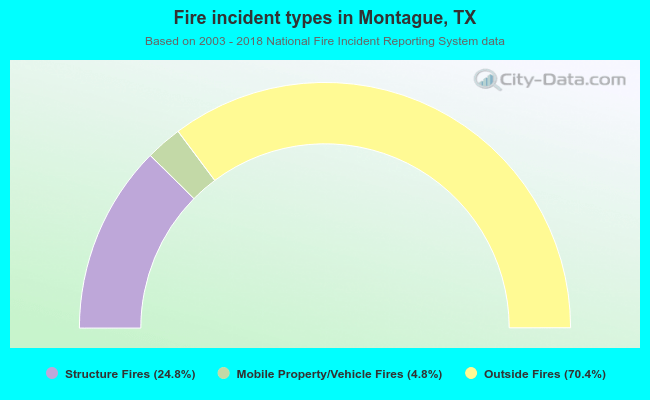 When looking into fire subcategories, the most reports belonged to: Outside Fires (70.4%), and Structure Fires (24.8%).